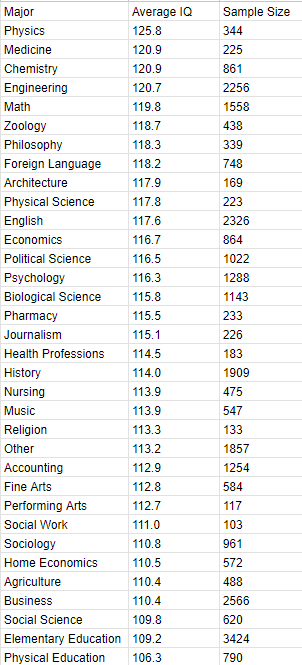
Razib Khan and Emil Kirkegaard have estimated the average IQ by college major using GRE and SAT scores, though I am fortunate enough to possess the Project Talent dataset, which has both IQ scores (measured at ages 12-18, for most) and college majors. They also test verbal/visual/mathematical ability, so I took advantage of that and plotted ability tilts by major, using the method Razib Khan used.
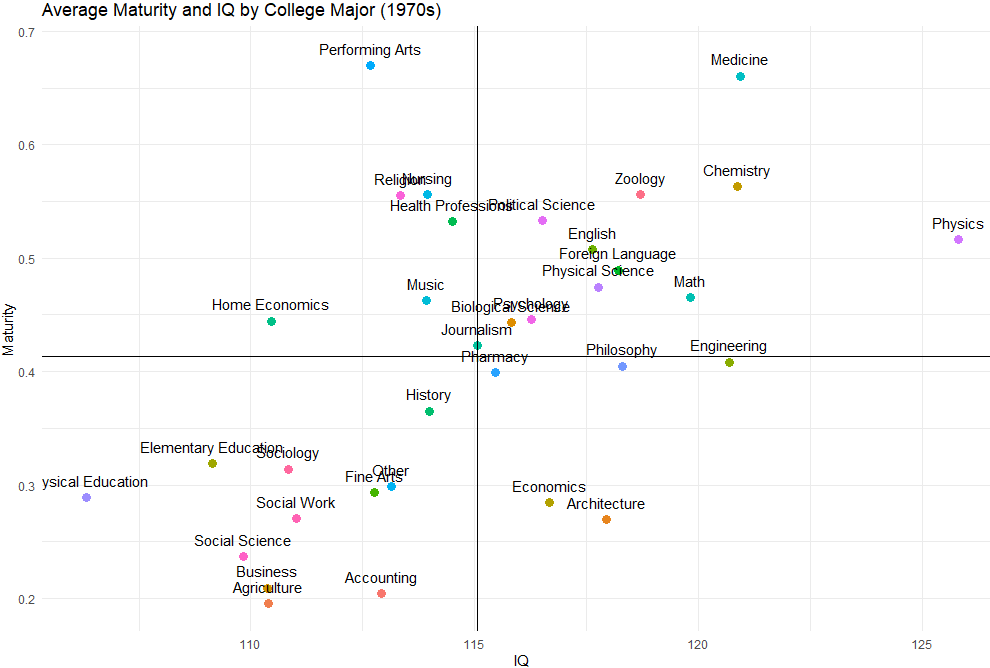
This dataset also includes measures of parental SES, extraversion, self-reported verbal ability, and maturity which I have included in the plots. Parental SES and IQ correlated at .45 in this dataset, identical to the value calculated in me and Emil’s study of race and honesty, suggesting that the data is probably accurate. The correlation between self-reported and measured verbal ability was .4, above what you tend to see in the literature, but not too out of the ordinary.
Technical information regarding how the estimates were made is available in the appendix.
Here is the average IQ by major:
Here are some plots:
Appendix/methodology:
Non-cognitive traits were standardized at a mean of 0 and standard deviation of 1, while cognitive traits were standardized at a mean of 100 and standard deviation of 15. This was done within the whole dataset, so the averages of the majors should differ from the mean.
Cognitive testing:
IQ was measured using the first general factor of general knowledge, memory, processing speed, verbal ability, mathematical, and visual ability
General knowledge was measured using a composite of technical and cultural knowledge
Technical knowledge was measured using the following variables: phsk, aerok, eleck, mechk, sportk, huntk, fishk
Cultural knowledge was measured using the following variables: screening, litk, musk, sstudiesk, mathk, biok, sciattk, farmk, homek, artk, lawk, healthk, engk, archk, jourk, fork, militk, salesk, prack, clerick, biblek, colorsk, etiqk, outdk, photok, gamesk, theatk, foodk, misc
Memory was measured using the following variables: sentmemory, wordmemory
Verbal ability was measured using the following variables: spell, capital, punct, english, express, words, reading, create, disgwords
Mathematical ability was measured using the following variables: arith, bmath, amath
Visual ability was measured using the following variables: mech, twod, threed, abst
Processing speed was measured using the following variables: arithfast, table, cler, obj
Subtest scores were adjusted for age
Missing values were removed.
Scorers with missing values were not scored.
Non-cognitive data:
Parental SES was measured using their ‘socio-economic index, measured in the first wave.
Maturity was measured using their ‘mature personality’ variable
Extraversion was measured using a composite of the ‘sociability’ and ‘social sensitivity’ variables
Overestimated ability was calculated by combining people’s self-reported reading/writing ability and controlling it for measured verbal ability.
As always, missing values were removed
Self-reported verbal ability was calculated by combining self-reported reading and writing ability
College major:
Statistics and math were combined
Biochemsitry and chemistry were combined
Data from the 11 year followup was used. If this was not available, data from the 5 year followup was used.
Individuals who had not completed their Bacherlors were excluded
Correlations between relevant variables (within the entire dataset):
Parental SES and IQ:
Parental SES and Extraversion:
IQ and Extraversion (note: these do not correlate in most datasets):
Correlation between Verbal (0.23) and Mathematical (0.1) ability with Extraversion:
Correlation between self-reported verbal ability and measured verbal ability:
dataset variable conversions for cognitive ability:
nd$arithfast <- nd$BY_F410
nd$table <- nd$BY_F420
nd$cler <- nd$BY_F430
nd$obj <- nd$BY_F440
nd$spell = nd$BY_R231
nd$capital = nd$BY_R232
nd$punct = nd$BY_R233
nd$english = nd$BY_R234
nd$express = nd$BY_R235
nd$sentmemory = nd$BY_R211
nd$wordmemory = nd$BY_R212
nd$disgwords = nd$BY_R220
nd$words = nd$BY_R240
nd$reading = nd$BY_R250
nd$create = nd$BY_R260
nd$mech = nd$BY_R270
nd$twod = nd$BY_R281
nd$threed = nd$BY_R282
nd$abst = nd$BY_R290
nd$arith = nd$BY_R311
nd$bmath = nd$BY_R312
nd$amath = nd$BY_R333
nd$screening = nd$BY_R101
nd$vock = nd$BY_R102 + nd$BY_R162
nd$litk = nd$BY_R103
nd$musk = nd$BY_R104
nd$sstudiesk = nd$BY_R105
nd$mathk = nd$BY_R106
nd$phsk = nd$BY_R107
nd$biok = nd$BY_R108
nd$sciattk = nd$BY_R109
nd$aerok = nd$BY_R110
nd$eleck = nd$BY_R111
nd$mechk = nd$BY_R112
nd$farmk = nd$BY_R113
nd$homek = nd$BY_R114
nd$sportk = nd$BY_R115
nd$artk = nd$BY_R131
nd$lawk = nd$BY_R132
nd$healthk = nd$BY_R133
nd$engk = nd$BY_R134
nd$archk = nd$BY_R135
nd$jourk = nd$BY_R136
nd$fork = nd$BY_R137
nd$militk = nd$BY_R138
nd$salesk = nd$BY_R139
nd$prack = nd$BY_R140
nd$clerick = nd$BY_R141
nd$biblek = nd$BY_R142
nd$colorsk = nd$BY_R143
nd$etiqk = nd$BY_R144
nd$huntk = nd$BY_R145
nd$fishk = nd$BY_R146
nd$outdk = nd$BY_R147
nd$photok = nd$BY_R148
nd$gamesk = nd$BY_R149
nd$theatk = nd$BY_R150
nd$foodk = nd$BY_R151
nd$misc = nd$BY_R152
Other variables used:
Y11_E305 - year 11 followup, college completion
Y11_E321 - year 11 followup, college major
Y5_E321 - year 5 followup, college major
Y5_E305 - year 5 followup, college completion
BY_P828 - self-reported writing skills
BY_P829 - self-reported reading skills


Oi oi oi-- EH!? NANDE YO!!! YOU BAKA!!!! *ahem* sorry, I am just baffled that Engineering is higher than math, even though the engineering field is famous for having many stupid retarded idiots in it who don't do any real work. Maybe engineering meant something else in the 1970s. Crazy how languages change over time.
Business and Elementary Ed being near the bottom is very believable today