


Brief Data Post

Differences between interracial and endogamous maters in the US Census
Shi Huang asked me and Charles Murray whether we found differences in IQ between Black mother/White father and Black father/White mother biracial children - we both said we didn’t know if there was a difference. However, the expected effect of self-selection can be estimated using proxies for IQ. In this case, I tested whether educational attainment varied by sex/race combination in interracial daters using data that I stole from this supplement. These were the results:
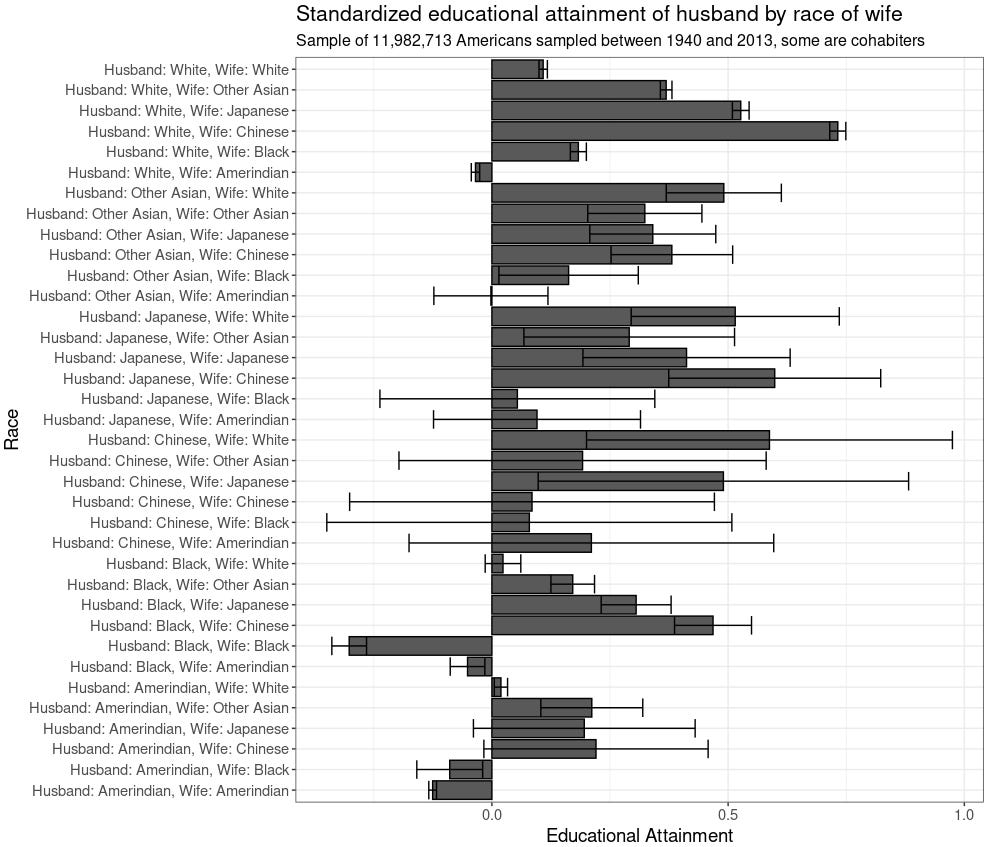
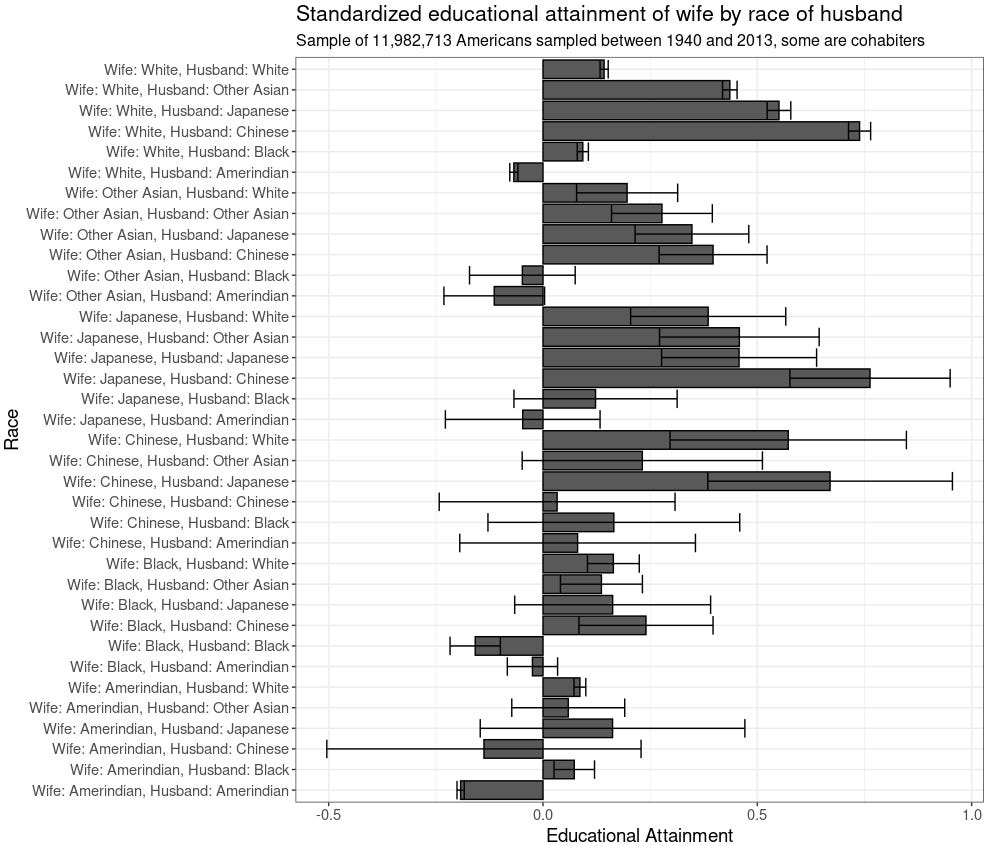
I can parse the following consistencies from the results:
People who date Chinese people are disproportionately likely to be high in educational attainment.
Men who date outside their race tend to be higher in educational attainment.
People who date highly educated races (e.g. Asians, Whites) are more likely to be highly educated themselves.
“Standardized educational attainment” in this situation is a composite of years of education + degree controlled for year/cohort effects.
Incel Rate Page

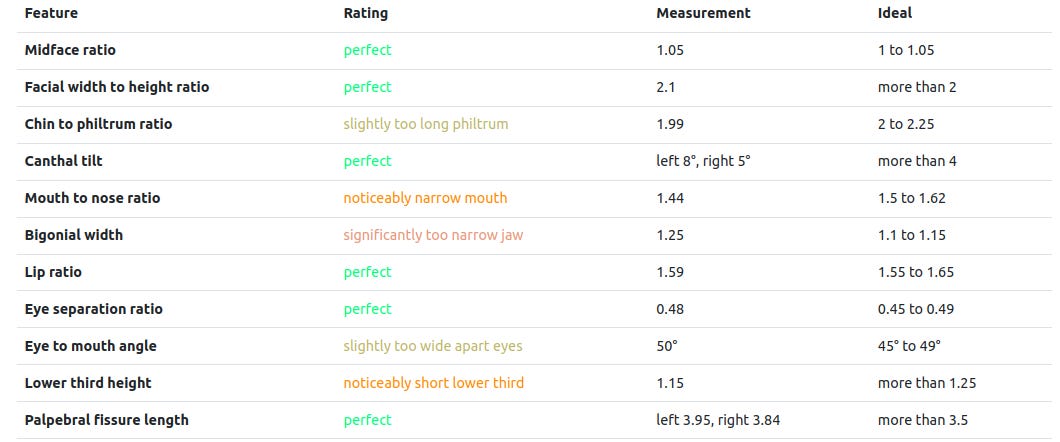
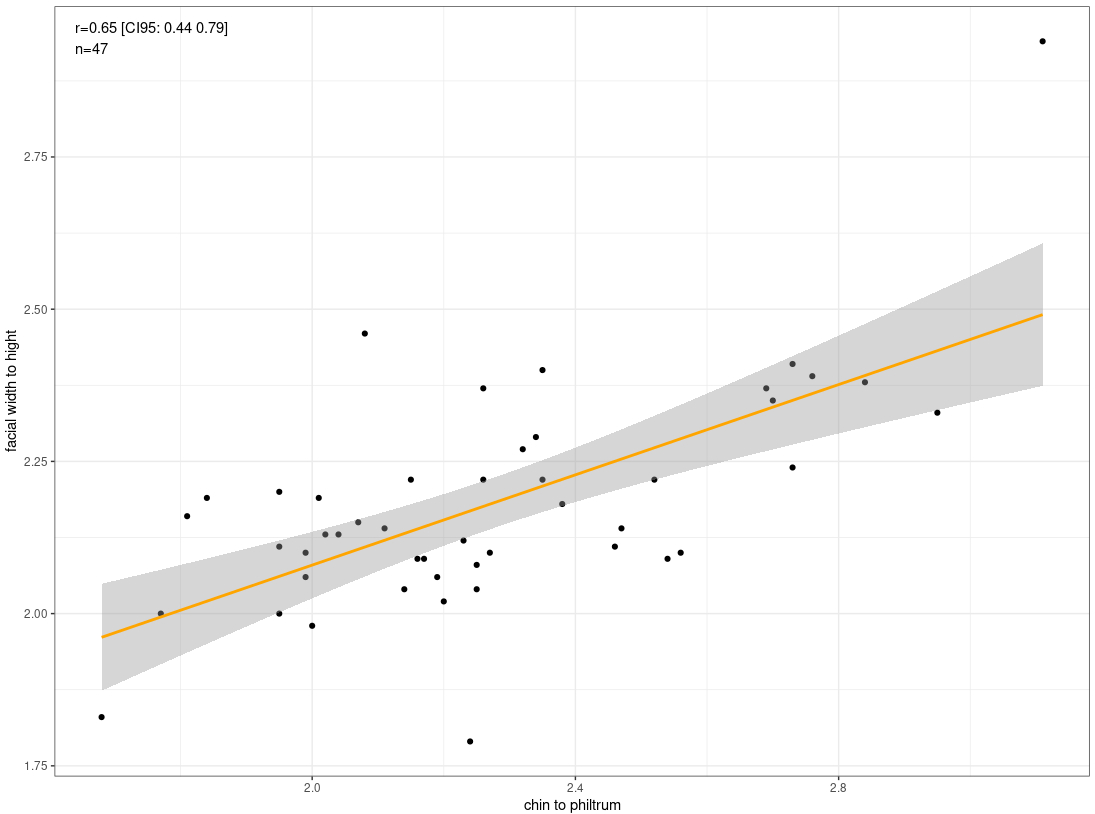
A new website has been launched that allows you to rate faces - looking through the results it seems to be pretty accurate, but one issue that stands out is that the facial width to height ratio estimates are inflated.
I collected 47 faces of non East Asian/Black men and found that the average FWHR The average is 1.8 within men, but the average in this dataset was 2.18. The sample is not representative (I chose random people on the internet, many from looksmax.org), but it’s still concerning.

My ratings of attractiveness didn’t correlate with any facial feature. Well, I did find a few p < .05, but those can be ignored.
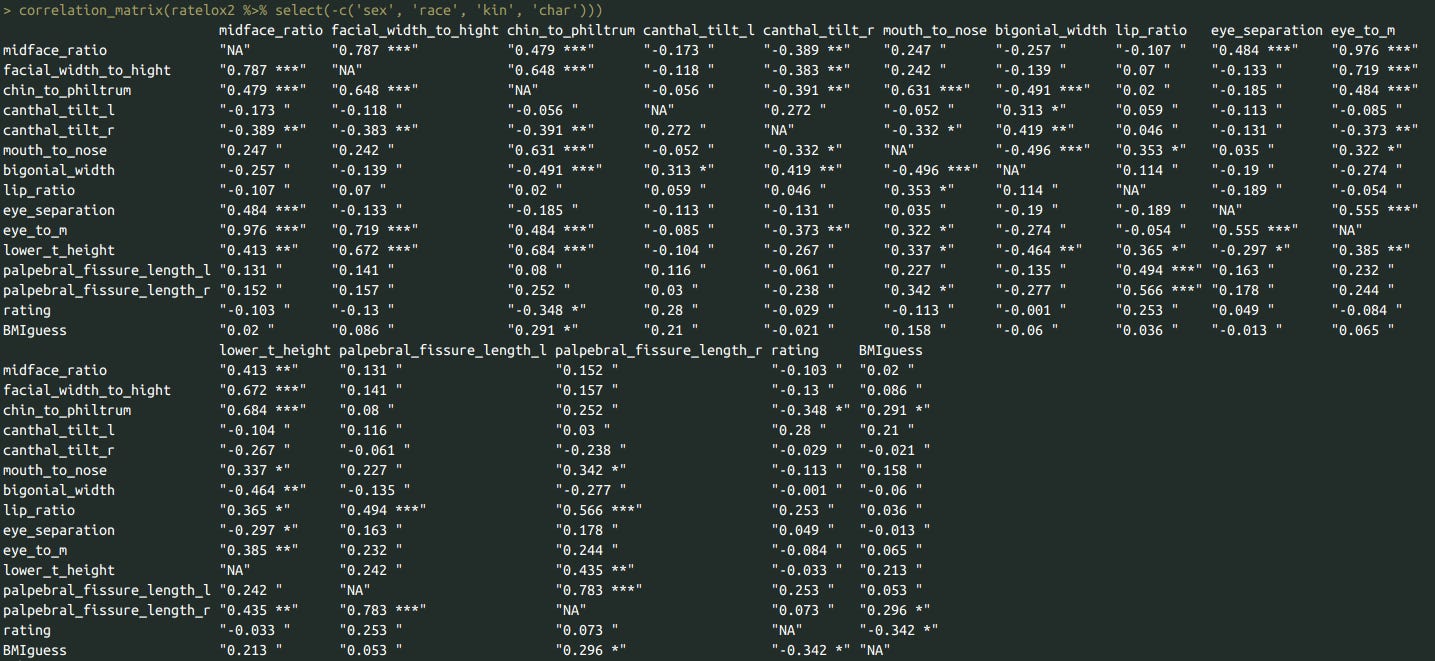
I tried looking at nonlinear relationships visually, but found nothing of note. So I decided to look at the trends between seemingly unrelated facial ratios and traits. All I could find was that people with higher facial width to height ratios also had higher chin to philtrum ratios (r = .65), as they are based on similar characteristics.
 - ARC")
 - Hyundai Aesthetics Blog")
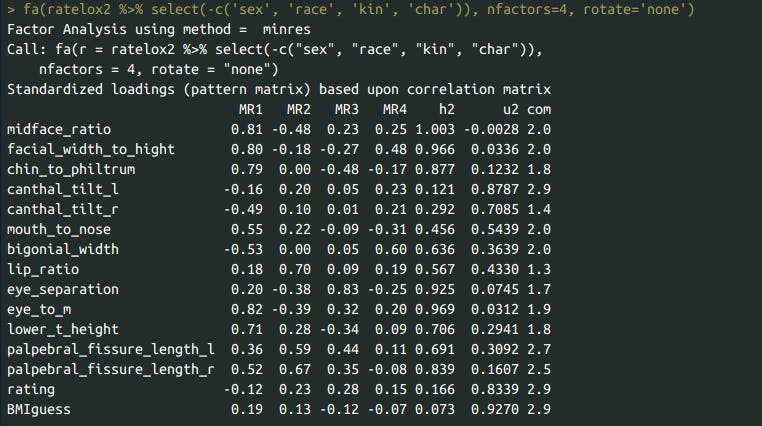
The parallel analysis suggested that there were 4 factors in the data - I extracted them out of curiosity. The first factor relates to the position of the eyes/nose/lips, the 2nd to the lip ratio/eye size (femininity? presentation of face? this is the easiest trait to manipulate), the third factor relates to the distance between the eyes, and the 4th to the width of the face.
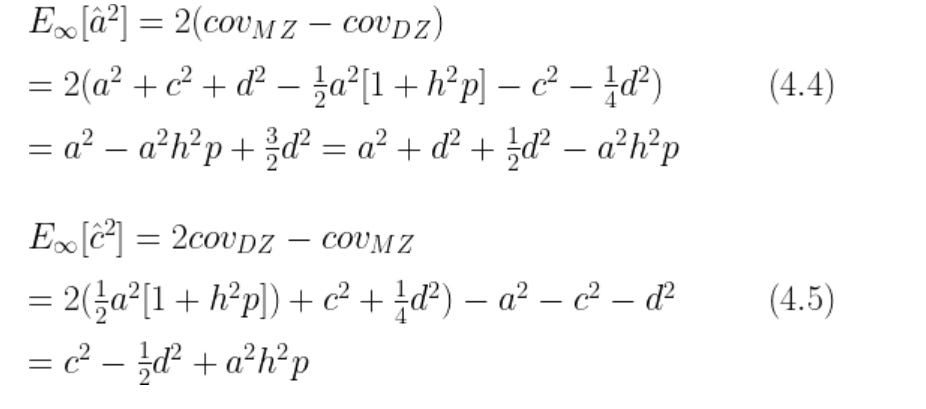
The Falconer Formula Estimates both additive and dominant effects
Not my work, but Dalliard has delved into the math of of twin studies in his great takedown of Joreskog’s ACDE model. In this post, he also delved into the math underlying the falconer formula [ A = 2(covMZ - covDZ) ], which is used to estimate the A component (additive genetics) of the trait. The expected value of this estimate is a^2 + d^2 + 1/2*d^2 - a^2*h^2*p, meaning that it estimates dominant variance and is also biased - upwards by dominant variance and downwards by of assortative mating. For the C component (shared environment), the opposite is the case - it is biased downwards by dominant variance and upwards by assortative mating.
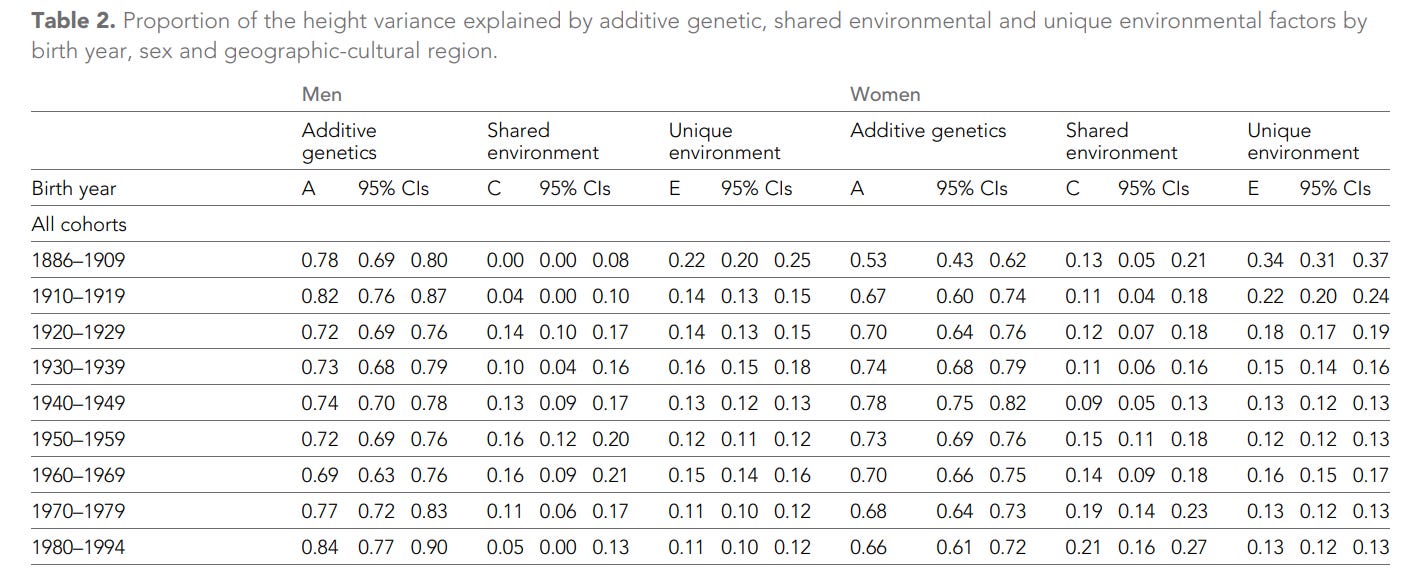
High heritability is compatible with large environmentally caused secular trends
Heritability is defined as the fraction variance in a phenotype that is associated with genes. This statistic is estimated using twins who share the same cohort, age, and group. Because of this, it is not the case that differences in a trait across cohorts are as heritable as the differences found within these cohorts.
Taking the example of human height, the meta-analysis pegs the heritability of human height at 90% in adults. However, have been large increases in human height within the last century - an increase of about 1.4 SD in American men, for example.

This is not due to genes, as height is under stabilizing selection within men and negative selection within women in most nations.
Taking the estimate of 90% at face value, this would imply an enormous environmental increase in height: 4.4 standard deviations (1.4/sqrt(0.1) = 4.4).
This extremely large number could be due to the fact the estimate is inflated - this is only partially true. The correlation between MZ twins reared apart is .86, which implies a heritability of 86%. Unfortunately, only 56 twin pairs were available for this estimate, making it unreliable.
Pedigree estimates of heritability are the best, as the bias of the different kin relationships (parent ~ child, aunt ~ niece) should average out to generate a more accurate estimate. Fortunately, some studies have tried to estimate the pedigree heritability of height, which are:
This one: 85% (n = 494)
This one: in their three best models, the H^2 of height was 85%, 85%, and 86%.
This one: 88% (n = 167,348)
The average of all model estimates is 86%, meaning that the classical twin method only inflated the heritability by only a bit. Using this more accurate heritability estimate still implies a large environmental increase across time periods (1.4/sqrt(0.14) = 3.74).
There doesn't appear to be a trend in the heritability of height across time periods, so this environmental increase across time did not change the heritability of the trait by a large amount. The absence of a large difference is not unexpected - heritability only indicates the proportion of a trait within a group/cohort that is associated with genes, not between groups and cohorts.
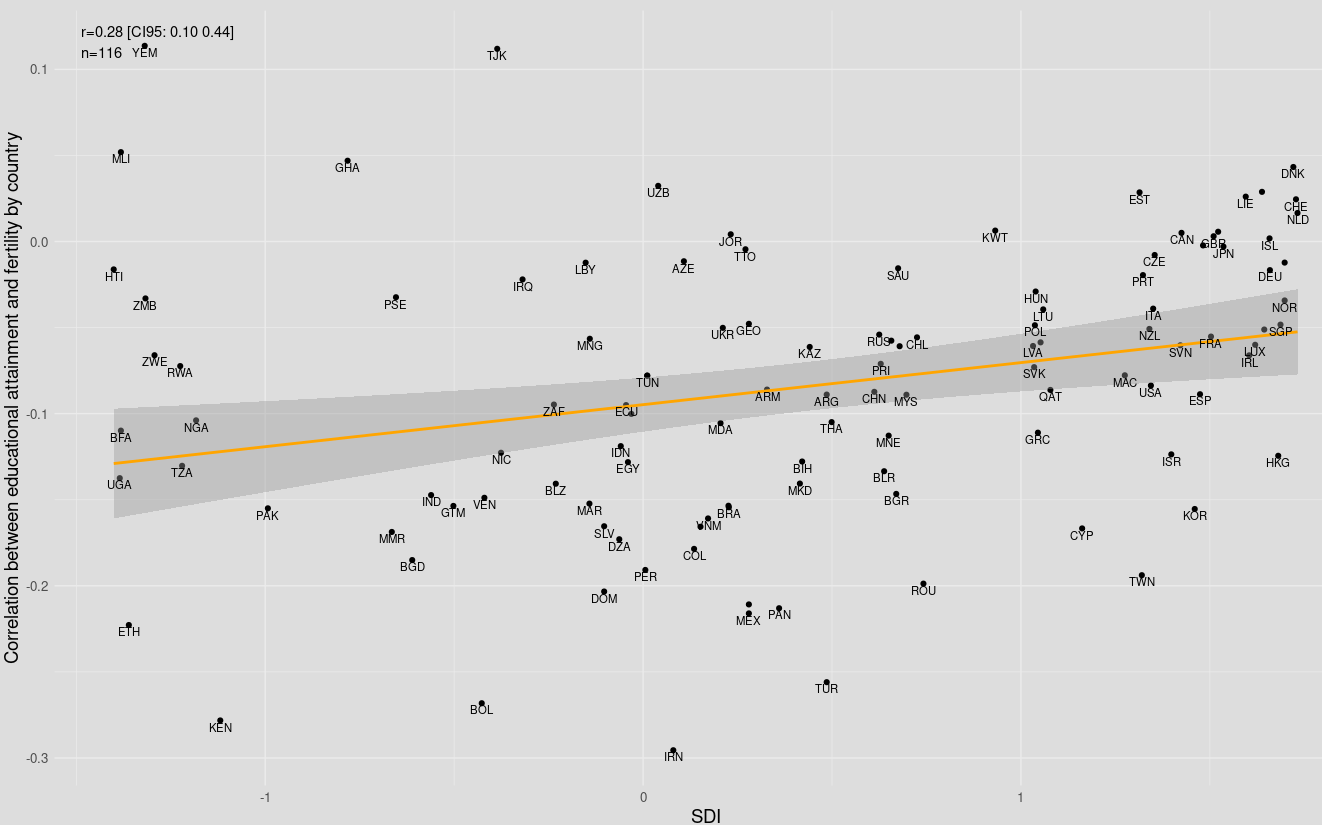
Meta-analysis of correlations between education and fertility
I recently collected about 900 effect sizes that calculated the correlation between education and fertility across the world.
The average correlation was -.13.
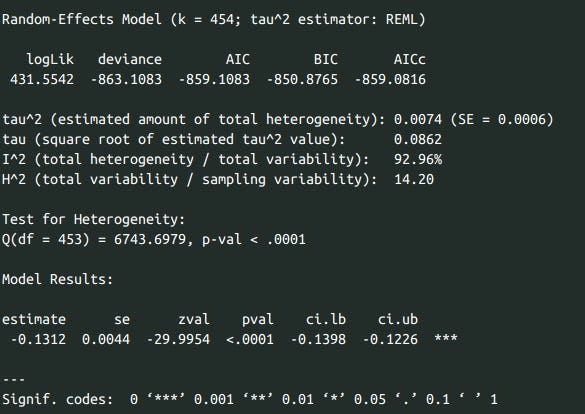
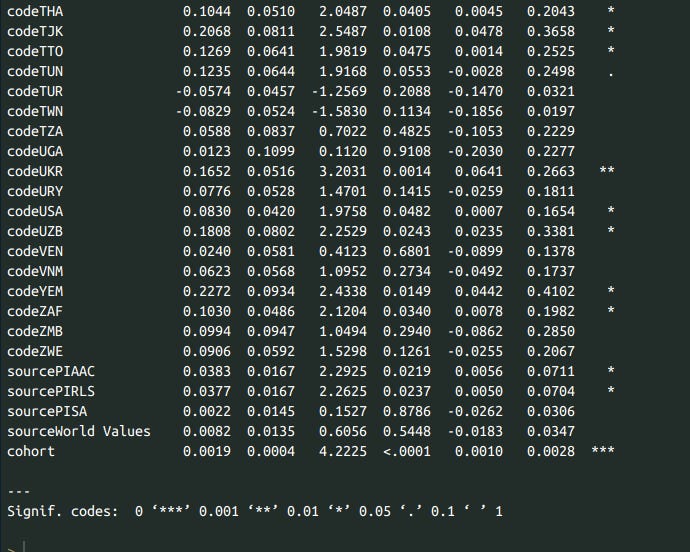
There is a secular trend in the correlation - it’s increasing. The increase holds even after controlling for country effects and sources of data (b = 0.019, p < .0001). All between country estimates from now on will be controlled for the effect of cohort years.
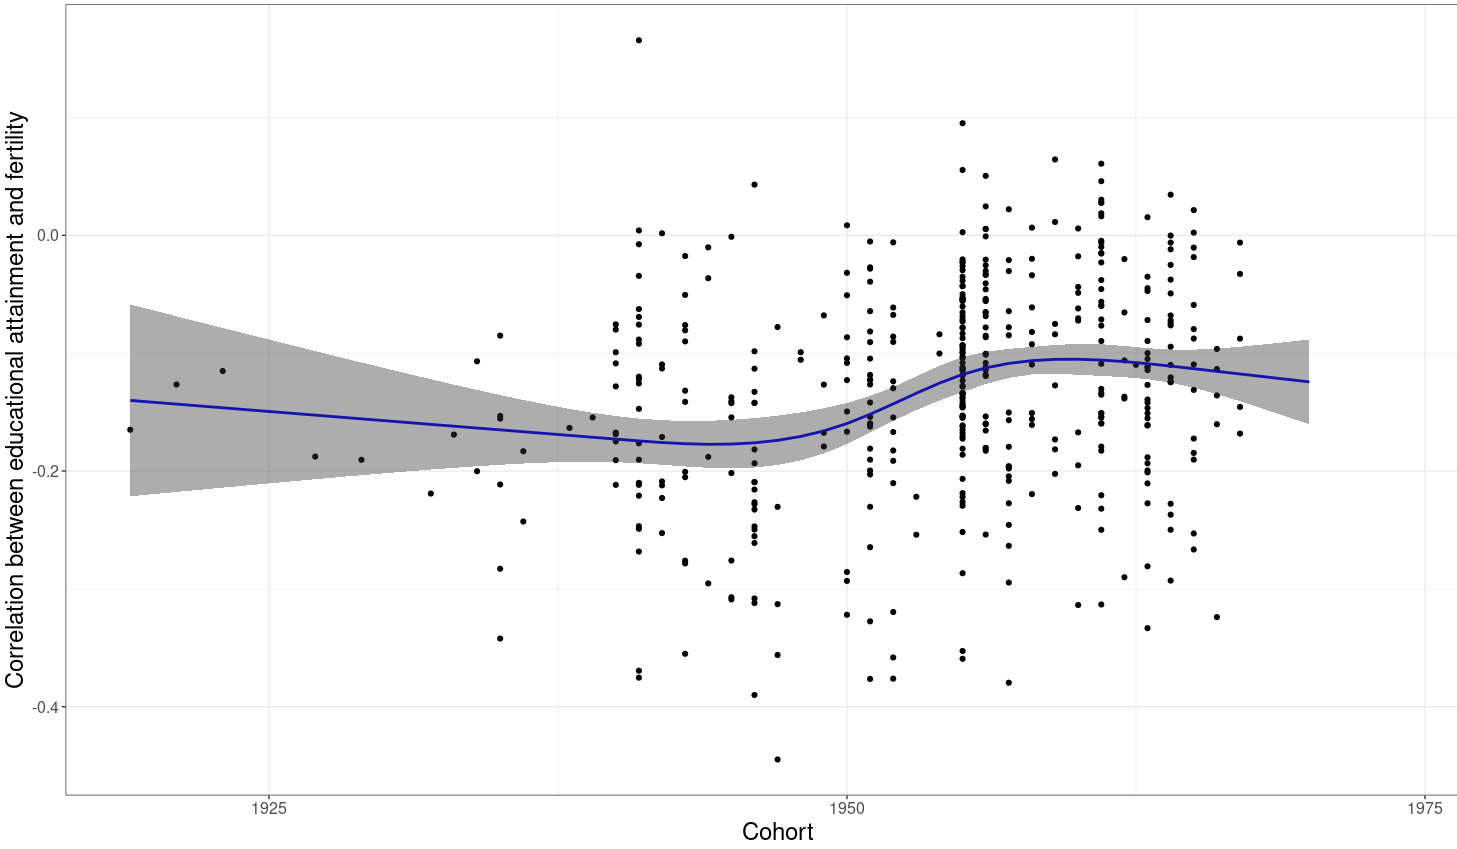
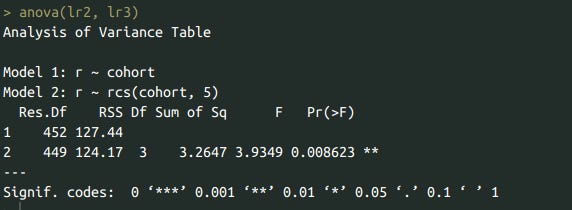
Nonlinear trend in cohort years passes significance according to the ANOVA:
World map of education dysgenics:
These are the correlations by country:
Sample size and number of effect sizes by country:
> print(timo, n=110)
# A tibble: 118 × 3
    code     n2     k
    <chr> <int> <int>
  1 ALB    3038     3
  2 AND    1080     2
  3 ARG    7004     7
  4 ARM    2220     3
  5 AUS    6100     5
  6 AUT    4290     3
  7 AZE    1189     2
  8 BEL    3748     2
  9 BFA     399     1
 10 BGD    1091     3
 11 BGR   10825     5
 12 BIH    1124     2
 13 BLR    1921     2
 14 BLZ    2858     1
 15 BOL     797     1
 16 BRA    5370     6
 17 CAN   29688     5
 18 CHE    5655     5
 19 CHL   17102     8
 20 CHN    5306     5
 21 COL    8740     4
 22 CYP    5773     5
 23 CZE   10611     6
 24 DEU   23376     9
 25 DNK   11590     4
 26 DOM      58     1
 27 DZA     833     2
 28 ECU    3160     3
 29 EGY    3698     4
 30 ESP   11212     8
 31 EST    2674     3
 32 ETH     442     2
 33 FIN    6628     5
 34 FRA   11354     5
 35 GBR   13783     7
 36 GEO    2427     3
 37 GHA     703     2
 38 GRC    9225     4
 39 GTM     605     2
 40 HKG   19937     5
 41 HRV    9844     2
 42 HTI     537     1
 43 HUN   20408     6
 44 IDN    5690     4
 45 IND    4803     5
 46 IRL    5012     3
 47 IRN   14690     4
 48 IRQ    2554     4
 49 ISL    7656     3
 50 ISR    6509     3
 51 ITA   64532     6
 52 JOR    1975     4
 53 JPN    6460     6
 54 KAZ    3727     3
 55 KEN     182     1
 56 KGZ    1572     3
 57 KOR   17361     9
 58 KWT     368     1
 59 LBN    1059     2
 60 LBY    1446     2
 61 LIE     132     1
 62 LTU   17991     5
 63 LUX    1215     1
 64 LVA    7557     4
 65 MAC   11902     2
 66 MAR    1570     4
 67 MDA    7695     4
 68 MDV     367     1
 69 MEX    7688     7
 70 MKD    6952     4
 71 MLI     439     1
 72 MMR     572     1
 73 MNE    1320     3
 74 MNG     643     1
 75 MYS    1462     3
 76 NGA    1428     5
 77 NIC     388     1
 78 NLD   12024     7
 79 NOR   10442     6
 80 NZL   14589     7
 81 PAK    1781     4
 82 PAN    6116     1
 83 PER    7636     7
 84 PHL    2136     4
 85 POL   13756     7
 86 PRI    1555     3
 87 PRT   11944     3
 88 PSE     338     1
 89 QAT   12260     2
 90 ROU   11239     6
 91 RUS   15332     7
 92 RWA     746     2
 93 SAU     329     1
 94 SGP   14188     4
 95 SLV     470     1
 96 SRB    3928     5
 97 SVK    9453     5
 98 SVN   10650     6
 99 SWE   16282     8
100 THA    4695     4
101 TJK     578     1
102 TTO    1067     2
103 TUN    1053     2
104 TUR   14259     8
105 TWN    2540     4
106 TZA     436     1
107 UGA     132     1
108 UKR    3774     4
109 URY    2329     4
110 USA   54121    31
RESULTS ONLY FOR WOMEN

RESULTS ONLY FOR MEN
###################
International Testing:
Weak (r = .23, p = .01) correlation between socioeconomic development (composite of about 50 different indicators, downloaded from the SPI and other websites) and the correlation between education and fertility by country.
When this is only restricted to men, the correlation increases a bit (r = .28, p = .002).
Sex difference in dysgenics:

A note: Haiti, the Dominican Republic, Kuwait are probably flukes (n < 400). Bosnia and Montenegro have decent sample sizes (n = ~1000), so maybe they aren’t, not sure. CBA to do statistical testing.
A criticism of the idea that religious/conservative people will inherit the earth

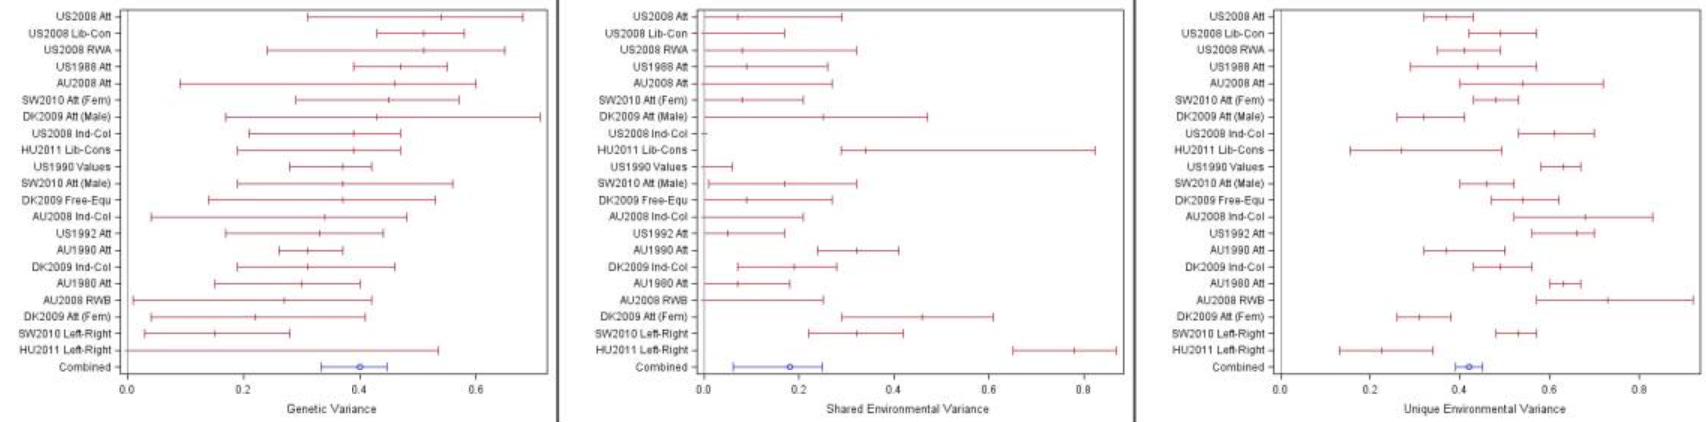
It is true that political beliefs are heritable. Twins reared apart are about as similar to each other in political beliefs and religiosity in comparison to twins reared together.

The correlations in the above study (.28-.53) concord well with the meta-analysis of the heritability of political views (H^2 = 40%) according to Hatemi’s meta-analysis.
While gene-environment covariance is basically a running joke in the behavioural genetics community at this point, it is true that gene-environment interactions matter for forming political views in particular. Intuitively - this makes sense, the environment would be the information and the genes would code the reaction to information.

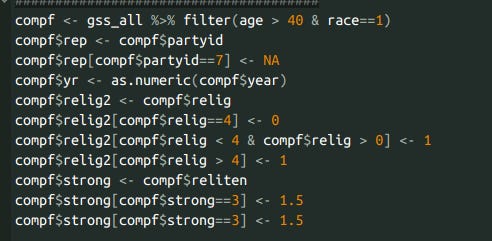
Besides the fact that the heritability of political views is low and complicated, Republican identification is not being selected for within the United States, despite the fact that conservatism and religiosity are.


Notably, controlling for conservatism/religiosity causes the relationship between republican identification and fertility to invert or disappear, depending on whether year/age effects are controlled for.


This selection is going to make the political gene pool worse, not better. Taking into consideration the large environmental trend in wokeness/irreligiosity, the political phenotype of the future is going to be socially conservative and collectivistic woke people, which sounds like absolute cancer.
The estimated phenotypic change could be calculated based on the additive heritability of political views and religiosity, but it would be uninformative as the environmental trend is more important for determining shifts in political views. What could be calculated instead is the expected genetic change, which would be an increase of 0.28 SD and 0.15 SD in religiosity and conservatism per century respectively, based on the breeder’s equation.
Edit: yes, I did restrict to Whites, as well as >40s.
The effect of Eurycoma longifolia on total testosterone
There is a meta-analysis on the effect of Eurycoma longifolia (tongkat ali, jack) on total testosterone.
Male hypogonadism is a clinical disorder characterized by reduced serum testosterone in men. Although treatment using herbal medicines, including Eurycoma longifolia, has been investigated, the benefits remain unclear. This study aims to investigate the efficacy of E. longifolia as a sole intervention to increase testosterone levels in males. Materials and Methods: We conducted a systematic review and meta-analysis of randomized clinical trials (RCTs) according to the PRISMA guidelines. Relevant articles were retrieved from the databases PubMed, Scopus, Web of Science, Cochrane, Ovid/Embase, and Google Scholar. Results: After literature screening, a total of nine studies was included in the systematic review. Five RCTs were included in the meta-analysis. A significant improvement in total testosterone levels after E. longifolia treatment was mostly reported in both healthy volunteers and hypogonadal men. The random model effect revealed a significant increase (SMD = 1.352, 95% CI 0.565 to 2.138, p = 0.001) in the total testosterone levels in men receiving E. longifolia supplementation, which was confirmed in the hypogonadism subgroup. Conclusions: This systematic review and meta-analysis of the literature supports the possible use of E. longifolia supplementation for enhancing testosterone production. Although more research is required before its use in clinical practice, this may represent a safe and promising therapeutic option, particularly in hypogonadal men.
The problem is, it’s junk. The publication bias is terrible, and the effect goes away after controlling for publication bias.


The site doesn't work
Your GSS results look problematic as you have no race controls.