
Economic inequality has massively increased ever since the dawn of civilization
Gini coefficient = meme

Economic inequality is defined as variance in resources within a population, be they assets, quality of materials, or quantity of materials. Because income can be exchanged for resources or turned into assets, it is traditionally used as a proxy for somebody’s economic class. Ideally, some composite of assets, goods, location, and income would be used to quantify that, but that information is usually not available, and even if it was, academics might just be too lazy to use it.
People use various statistics to attempt to estimate inequality in a given society. The standard one is the gini coefficient, which calculates how much the distribution of income deviates from one of perfect equality. Visually speaking, it’s the area between the cumulative distribution of income and a straight line:

A nice statistic, but an incomplete measurement of inequality. Consider two societies:
A has 10 people making $1,000 and 1 person making $10,000
B has 10 people making $10,000 and 1 person making $100,000
These societies have the same Gini coefficient:
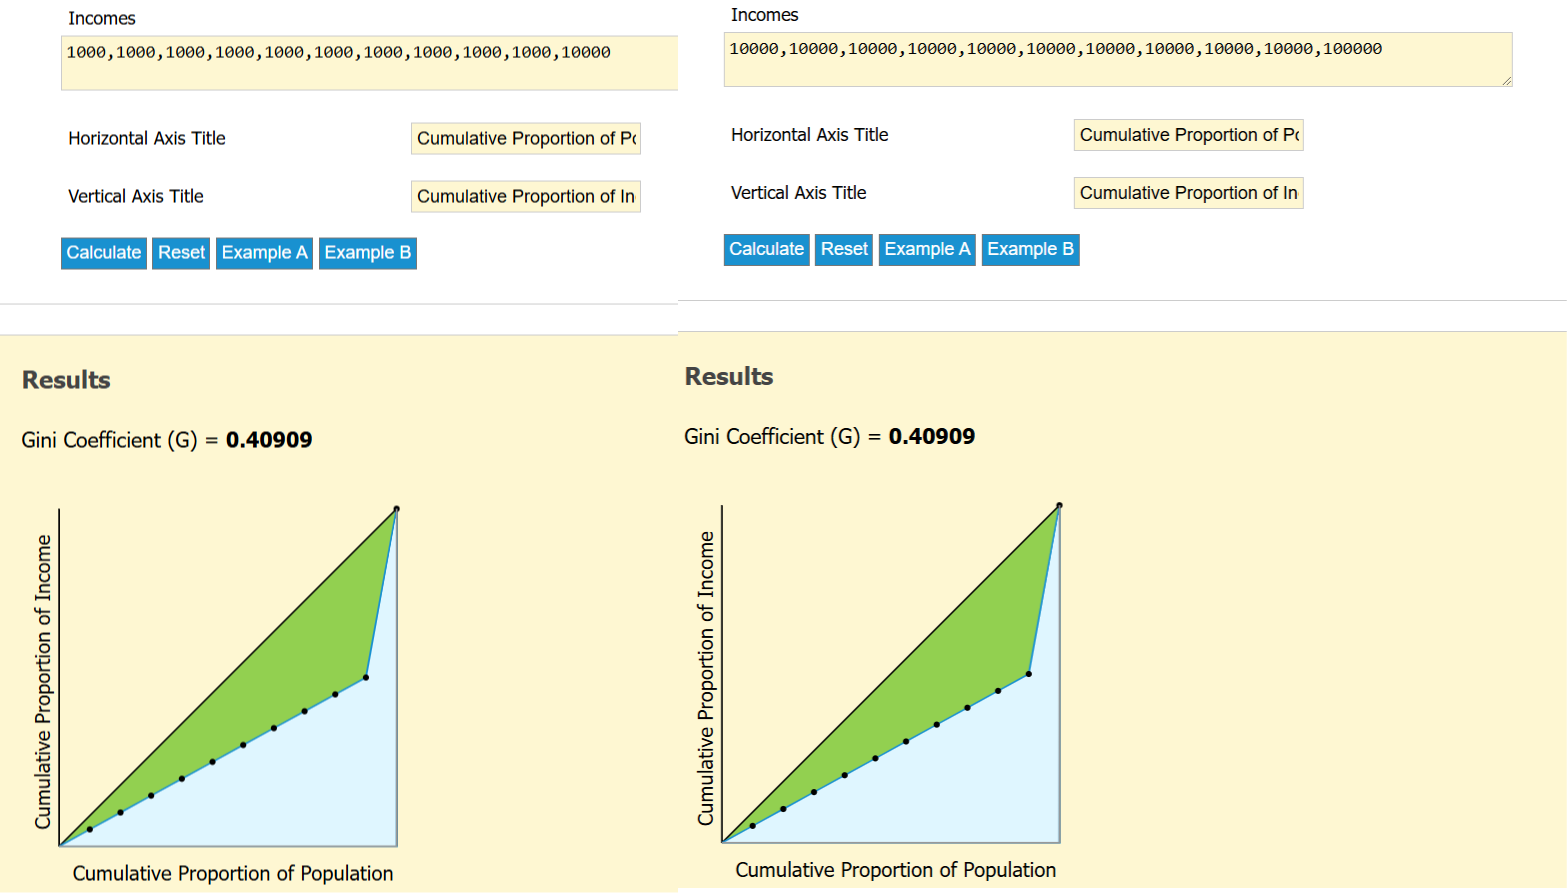
But not the same level of absolute economic equality. In society A, the richest person of the 11 can buy 12 models of the latest iphone while his poorer companions can afford only 1. In society B, the poor people can buy 12 iphones while the richest person can buy 125. In society A, that’s a difference of 11, while in society B, it’s a difference of 113.
I, instead, contend that inequality should be measured be measured with the mean absolute difference or the standard deviation, which measure how much the average person deviates in income from the mean income. This will bias the measurement in favour of wealthier populations, but I would consider that appropriate: if a given nation is 5x richer, then scale invariant inequality is 5x as important.
Census data
On my PC, I have US census data from the years 1940, 1960, 1970, 1980, 1990, 2000, 2008, 2009, 2010, 2011, 2012, and 2013: a total of 14,992,174 respondents between the 12 years. There is income data for both the husband and the wife.
Here I plot the Gini coefficient (using the reldist package) by year within both sexes:
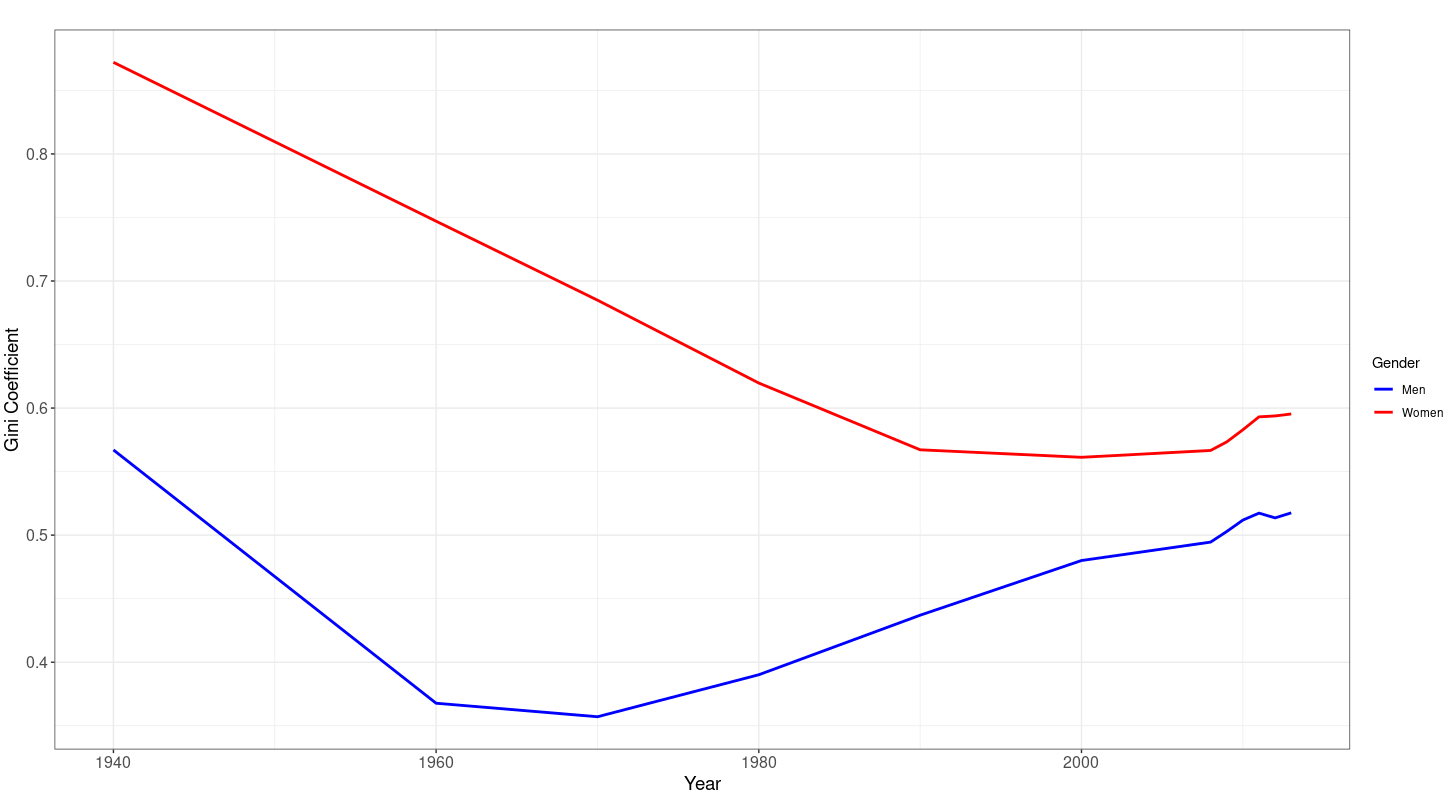
According to the Gini coefficient, income inequality decreased massively within women, probably due to an increased presence of women in the workforce, while inequality within men dropped from 1940 to 1970 and increased thereon afterwards. Overall fairly moderate changes, especially when you focus on the male data.
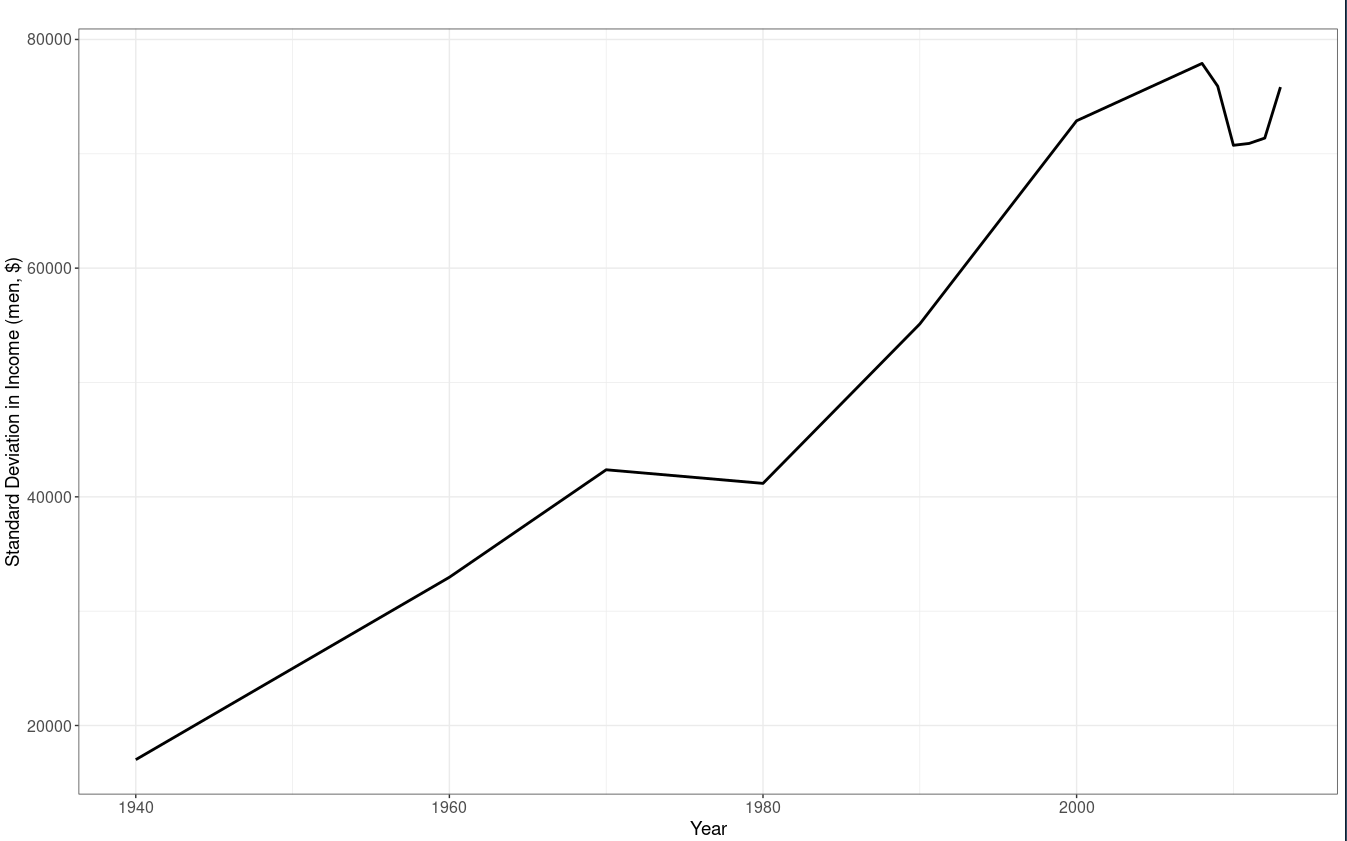
The standard deviation, on the other hand, tells a very different story:
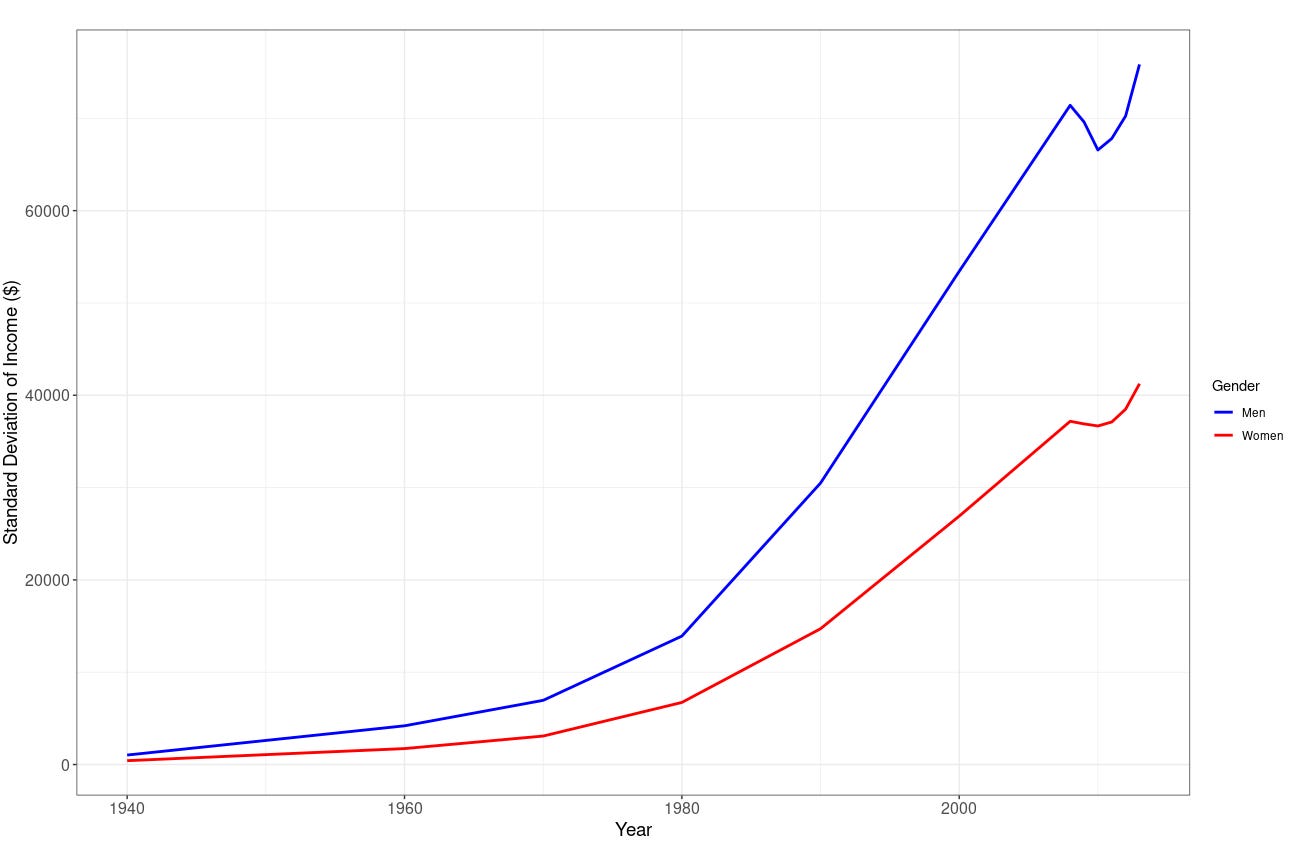
The standard deviation in income for men in 1940 was $1027, while in 2013 it was $75836. I attempted to test whether this held after adjusting for inflation using the BLS’ CPI inflation calculator, and it did, though the increase in inequality is far smaller: an increase of 4x rather than an increase of 75x.
This tracks almost perfectly to the increase observed in mean income within men: on average, a man earned $15,622 in 1940 (adjusted for inflation) and $63,344 in 2013 — another 4x increase.
Other times and places
From what I gather, the norm for the Gini coefficient for income before the industrial revolution was about 0.2 to 0.7 — 0.5 in 1300-1500 Tuscany, 0.7 in 1500-1700 Tuscany, 0.7 in 1500-1700 Appalachia, 0.5 in 1500-1700 low countries, ~0.7 in Medieval Britain, 0.2 in the Roman Empire, 0.1-0.4 in Neolithic Near East, 0.2-0.6 in the Bronze Age Near East, and 0.1-0.3 in the Iron Age Near East.
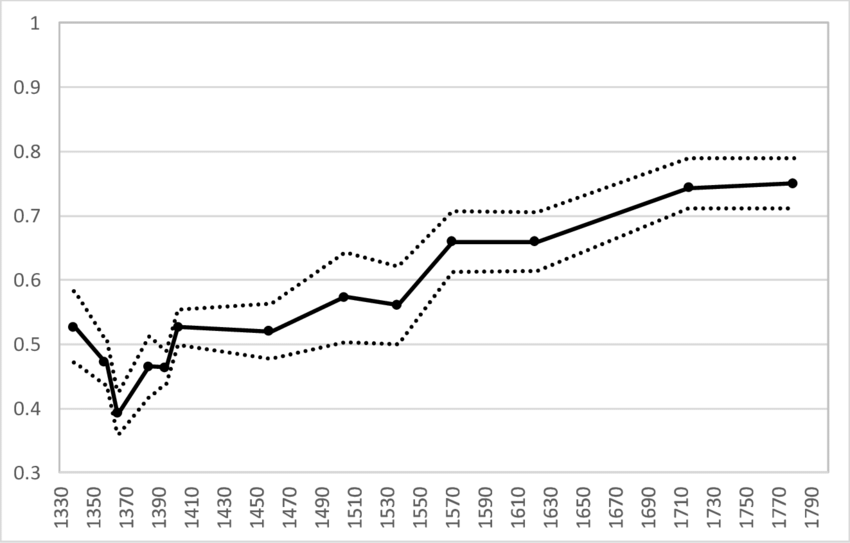
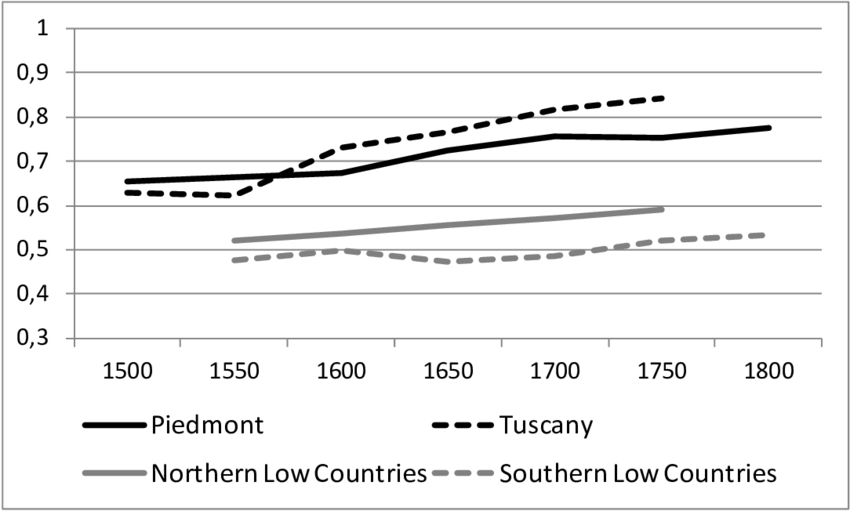


So not only have human societies gotten much richer over time; they’ve also become more unequal, even when the same societies are tracked over time (with the exception of the Roman Empire). I’m not exactly sure how the math works here, but if human societies got 50% richer from 0AD to 1800AD, and the Gini coefficient went from 0.2 to 0.6, then perhaps overall inequality increased by 4.5x.
Afterwards, the data is less sparse and more clear — from a Gini perspective, inequality has been stagnant in the average country:
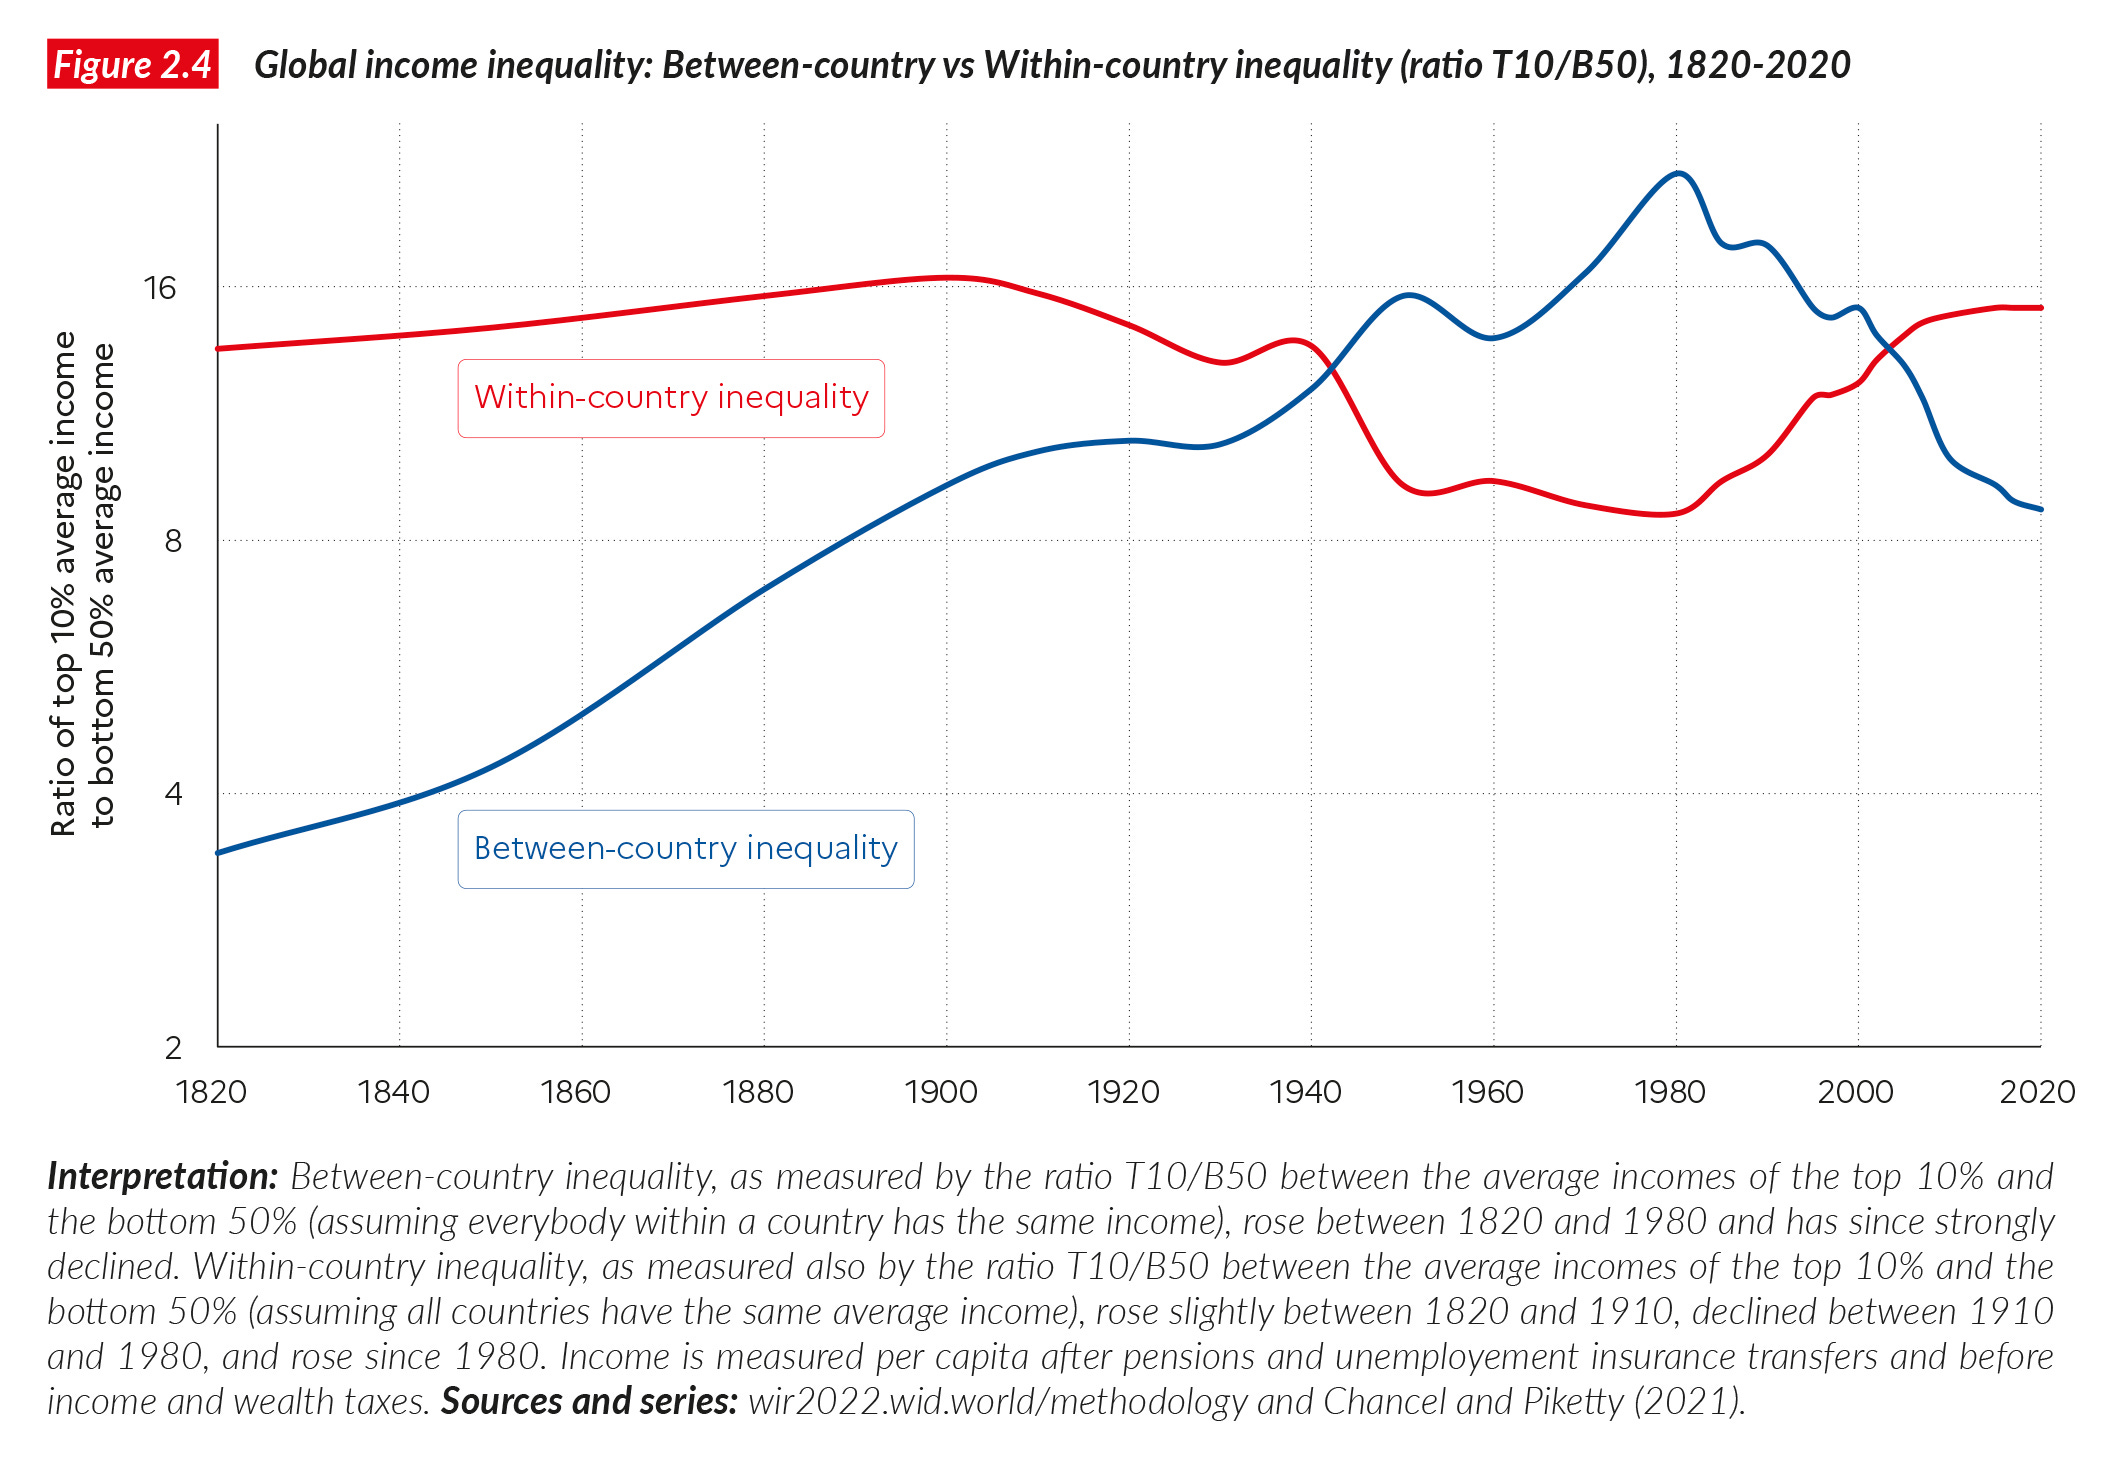
This can change depending on methodology, for example, the rise in inequality within the USA post 1960 is mostly attenuated when transfers and taxes are taken into consideration.

I would expect that Gini inequality globally has slightly reduced due to the welfare state, but the world GDP per capita has since skyrocketed — it went from $1,500 in 1820 to $20,000 in 2023, so overall inequality has increased by about 10x ever since the industrial revolution.
Is this good?
I’m not sure.
There are five reasons to try to earn money — the main one is to satisfy basic needs like housing, food, and whatnot, but it can also serve to gain status, an increased standard of living, pleasure, or freedom; once one has a certain amount of money they are able to retire. In the modern day, the main function of money is irrelevant since it’s so easy to be housed and fed. Cheap entertainment is also abundant and palatable, so using moneys’ dopaminergic purposes has decreased, so money only really has three uses in the modern day.
At the aggregate level, inequality in standard of living doesn’t really matter in terms of utility or practical consequences, but increased income inequality has resulted in money becoming a more pertinent status game to play. I would consider this a bad thing — money is one of the lamest status games out there, as it’s much more easy and enjoyable to gain status through the force of one’s personality, appearance, or talent.
The upside of increased wealth inequality is that there are more people who are rich enough to buy their freedom. I’ve heard some people find retirement unbearable and go back to work soon afterwards, but perhaps these people were born to be slaves and are in denial about it.
Appendix
Output of the census data:
> censusda
     yr        sdw       sdh     giniw     ginih
1  1940   419.2483  1027.801 0.8720863 0.5670524
2  1960  1728.0798  4194.643 0.7470499 0.3677153
3  1970  3086.0742  6954.338 0.6849167 0.3570844
4  1980  6727.4159 13911.475 0.6196843 0.3901456
5  1990 14711.4658 30493.515 0.5671582 0.4370034
6  2000 26908.8058 53429.274 0.5612622 0.4800323
7  2008 37179.3314 71408.478 0.5666518 0.4945254
8  2009 36897.1024 69599.846 0.5733583 0.5028425
9  2010 36672.4869 66567.437 0.5829098 0.5118313
10 2011 37103.3043 67808.629 0.5930871 0.5173154
11 2012 38496.4599 70254.466 0.5937995 0.5135812
12 2013 41247.2411 75835.775 0.5953752 0.5175442
Besides moralizing about unfairness, one of the reasons why people argue that we should try to lower inequality is that inequality leads to revolts and social instability.
I would argue that this isn't the case -- it's actually sudden declines in welfare (recessions, depressions) which cause social instability.
I would argue that, from the perspective of preventing revolutions, it would be better to set aside a rainy day fund to absorb the impact of economic corrections (like Joseph in the Bible) than to attempt to eliminate inequality.
As societies became more developed, it became easier to store wealth. Hunter gatherers literally couldn’t efficiently own anything they couldn’t carry on their backs. Neolithic pastoralists and farmers could amass stuff, but their money was living things that could die or rot. Bronze Age societies had coinage but no banks