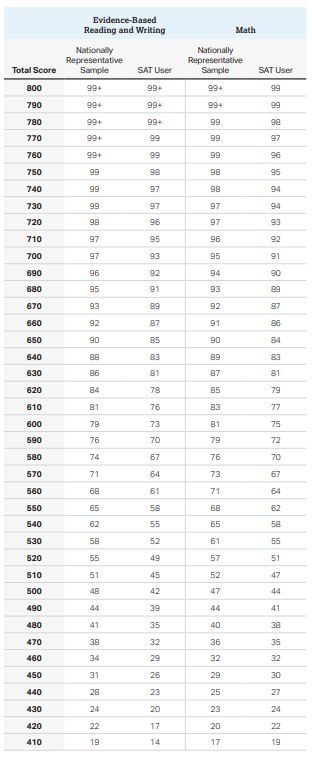
Function to infer the mean and standard deviation from percentile chart
Lets say you want to convert one of these charts into a distribution with a mean and a standard deviation:
I generated a function that finds the combination of mean and standard deviation that best fits the table. In this example, the best combination for both distributions would be:
Math:
Mean: 520.5
SD: 125
Average deviation: 11.89
Reading:
Mean: 531
SD: 108.5
Average deviation: 8.6
This is decided by finding the combination of means and standard deviations that fits the distribution the best, that is, has the smallest amount of deviation from the predicted scores and the actual scores.
Here, the average deviation is calculated by taking the total amount of deviation observed between the normal distribution and the table, and dividing that by the length of the table.
e.g: Average_deviation = total_deviation / length_table
So, a table with 2 observations where you missed the 1st score by .5 and the 2nd by .1 would have an average deviation of .3.
You can alter what percentiles you want to use, the scores for those percentiles, the range of means you want to test, the range of SDs you want to test, the increments for those means, and the increments for those SDs. If you want, you can change the increments to .1, and in this case the results are:
Math:
Mean: 520.2
SD: 125.5
Average deviation: 11.89
Reading:
Mean: 531
SD: 108.8
Average deviation: 8.6
Clearly, the function gives little return past increments of .5, while taking about ~25x the time to run. Because of that, I recommend relatively large increments.
edit:
Emil told me that you could just make an optimization function - it turns out this works pretty well!. I get roughly the same values for the optimal mean (520.21) and standard deviation (125.54) when I use optimization instead of the weird thing I invented.
SAT means/SDs by year:
2022 SATM mean = 520.2 | SD = 125.5
2022 SATV mean = 531 | SD = 108.8
2021 SATM mean =
2021 SATV mean = 531 | SD = 108.8
I don’t know how to make packages in R, so I’ll just post the R code:
neko <- function(percvec, scorevec, meanmin=510, meanmax=530, sdmin=98, sdmax=110, meaninc=1, sdinc=1) {
  meanvec <- seq(from=meanmin, to=meanmax, by=meaninc)
  sdvec <- seq(from=sdmin, to=sdmax, by=sdinc)
  mindev = 99999
  curdev = 0
  bestmean = 0
  bestsd = 0
  if(length(percvec)==length(scorevec)) {
    for(i in meanvec) {
      for(j in sdvec) {
        for(k in 1:length(percvec)) {
          pred <- qnorm(percvec[k], mean=i, sd=j)
          curdev = curdev + abs(pred-scorevec[k])
        }
        if(curdev<mindev) {
          bestmean=i
          bestsd=j
          mindev=curdev
        }
        curdev=0
      }
    }
  }
  else {
    print("Error: percentile vectors and score vectors are of different lengths")
  }

  print(paste("Best mean:", bestmean))
  print(paste("Best SD:", bestsd))
  print(paste("Average deviation:", mindev/length(percvec)))
}

mathpercvec <- c(.99, .99, .98, .97, .96, .95, .94, .94, .93, .92, .91, .90, .89, .87, .86, .84, .83, .81, .79, .77, .75, .72, .70, .67, .64, .62, .58, .55, .51, .47, .44, .41, .38, .35, .32, .30, .27, .24, .22, .19, .15, .14, .12, .09, .07, .06, .04, .03, .02, .01)
mathscorevec <- seq(from=310, to=800, by=10)
mathscorevec <- rev(mathscorevec)
neko(percvec=mathpercvec, scorevec=mathscorevec, meanmin=510, meanmax=550, sdmin=98, sdmax=135, meaninc=.1, sdinc=.1)

rpercvec <- c(.99, .99, .98, .97, .97, .96, .95, .93, .92, .91, .89, .87, .85, .83, .81, .78, .76, .73, .70, .67, .64, .61, .58, .55, .52, .49, .45, .42, .39, .35, .32, .29, .26, .23, .20, .17, .14, .12, .09, .07, .06, .04, .03, .02, .01)
rscorevec <- seq(from=330, to=770, by=10)
rscorevec <- rev(rscorevec)
neko(percvec=rpercvec, scorevec=rscorevec, meanmin=510, meanmax=550, sdmin=98, sdmax=135, meaninc=.1, sdinc=.1)

#optimization:

dat=data.frame(mathpercvec, mathscorevec)

tomin <- function(par, d) {
  with(data, sum(abs(qnorm(mathpercvec, mean=par[1], sd=par[2]) - mathscorevec)))
}

optim(par=c(0, 1), fn=tomin, d=dat)


