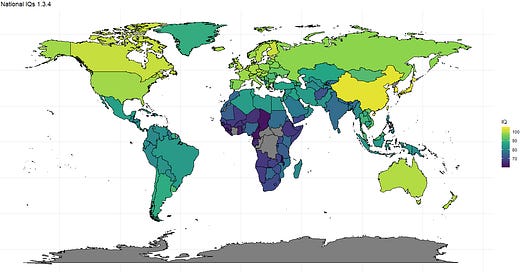
David Becker has recently released his revised estimates of national IQs - which estimates that China has an IQ of about 103.9 according to his composite of IQ scores and test assessments.
Given that China has a reputation for corruption and scientific fraud, many are skeptical of this estimate. In addition, tests given to urban Chinese might not apply that well to rural Chinese, making testing the average IQ of China difficult. Fortunately, there are some 3rd parties that have estimated China’s IQ based on international cognitive assessments such as PISA, TIMSS, and whatnot.
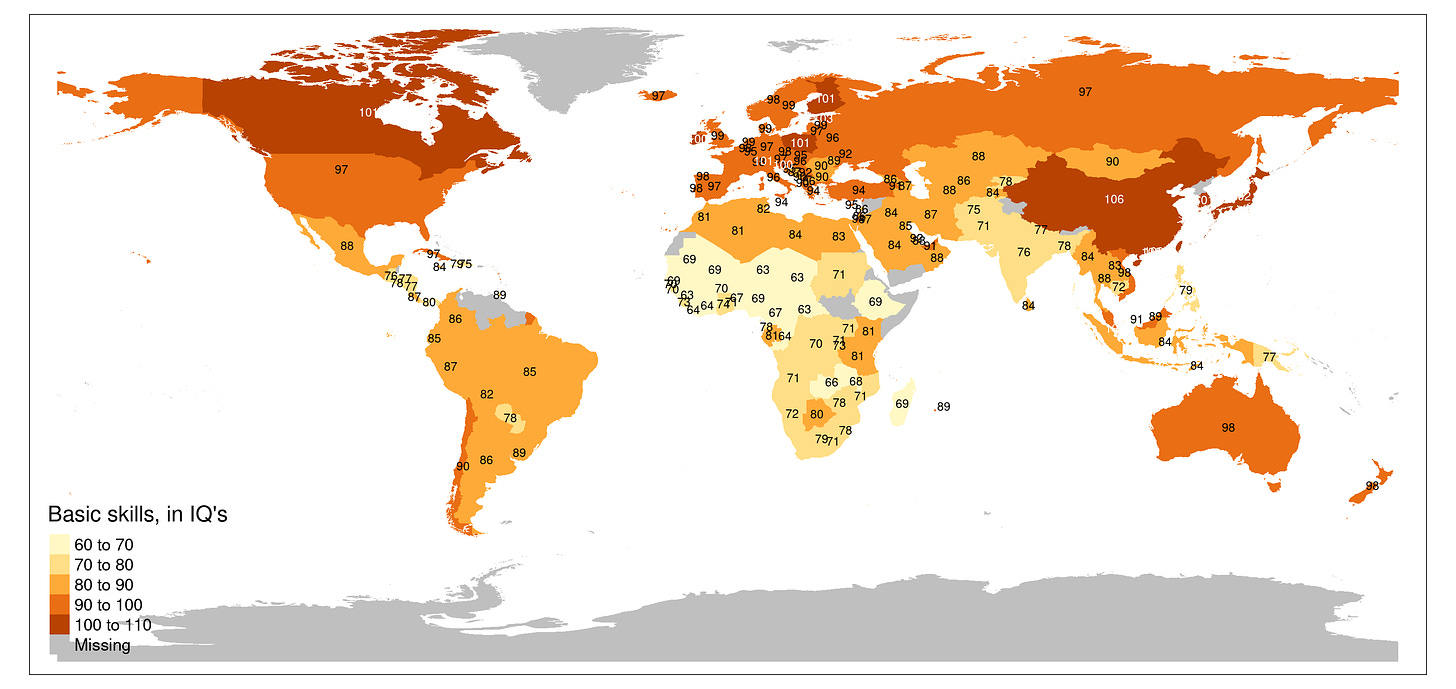
One includes a set of people who have had their skills tested - which seems to be testing a proxy for IQ more than anything. Which makes sense, as a lot of these estimates for ‘basic skills’ are actually generated using scholastic achievement tests such as the PISA and TIMSS. Relative to the UK, China was estimated to have an IQ of 107.
The harmonized test scores are also an attempt to do something similar: a dataset which collects composites of national achievement on standardized tests. For some reason, China has performed rather poorly on this metric - they scored the equivalent of an 89 relative to the UK when all 3 years are considered.
The people who generated these estimates have this to say about that in their report:
With nearly 1.4 billion people, the People’s Republic of China is the world’s most populous country and has the world’s largest education system. While special administrative regions of China, namely, Hong Kong and Macao, have been regular participants in international standardized assessments (ISATs) like TIMSS/PIRLS and PISA, China, as a country, has yet to participate.
However, a few provinces have participated in PISA over time, which has provided some insight into the quality of education in China. In 2009 and 2012, the province of Shanghai participated in PISA and was the top-performing economy in both years. Shanghai is predominantly urban with 88 percent of the residents in urban areas. The city’s income per capita is also more than twice as high as the national average. In 2015, four provinces, Beijing, Shanghai, Jiangsu and Guangdong (B-S-J-G) participated in PISA. With the inclusion of relatively less urban and less affluent provinces of Jiangsu and Guangdong as compared to Shanghai, PISA scores for China dropped from first to tenth place. These four provinces of China cover 17 percent of China’s population and give us an insight into education quality in a less affluent region than Shanghai alone: per capita income in BS-J-G is 1.49 times the national average. However, this income gap is still large and so PISA scores for B-S-J-G are unlikely to be representative of China as a whole.
Apart from the participation of four provinces in PISA, some independent efforts have been conducted to assess education quality in other provinces in China. One such effort is led by the Rural Education Action Program at Stanford. In 2015, researchers at REAP led a reading assessment to assess education quality in Shaanxi province and rural areas of Guizhou and Jiangxi provinces. The reading tests were constructed by trained psychometricians and used test items from the Progress in International Reading Literacy Study (PIRLS), thereby allowing international comparison. Results show that Chinese provinces of Jiangxi and Guizhou stood last in comparison to other countries participating in PIRLS 2011. The provinces represent 5.8 percent of the population in China and give insight into the education quality in rural, less affluent regions of China: average per capita income in these three regions is just 60 percent of the national average.
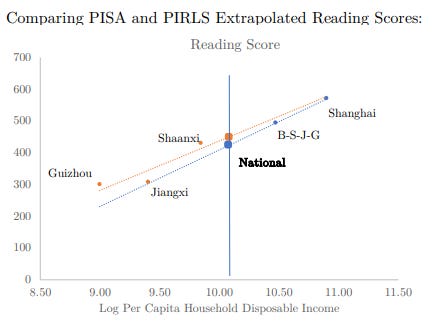
We combine information from PISA scores as provided by OECD and PIRLS scores as provided by REAP to estimate the average education quality in China. For both programs, the fundamental problem is that the test scores are obtained in provinces that are unlikely to be nationally-representative of educational quality given the income gaps noted above. Even taking a population-weighted average of PISA and PIRLS scores for the seven provinces is unlikely to result in nationally-representative scores. This is because the average per capita income of these areas is still much higher than the national average. Average household income in B-J-S-G is 1.49 times the national average, while average household income in all seven provinces covered by PISA and PIRLS is 1.26 times the national average.
Therefore, in addition to these estimates for seven provinces, we approximate nationallevel test scores by extrapolating the observed PISA and PIRLS scores based on per capita income. Specifically, we extrapolate PISA scores for Shanghai (2012) and B-S-J-G (2015) to the national average using log per capita disposable income, separately by subject. Below we include tables which showcase this calculation.
To summarize, they extrapolated what China’s average harmonized test score would be if they tested all of China based on their average national income.
I suppose this is good evidence that the China IQ is overestimated, but correlations with 5 data points aren’t particularly reliable, so it’s difficult to judge exactly what China’s national IQ is.
The basic skills dataset still does find an estimate that is in line with the rest of East Asia, so that must be addressed as well. Fortunately, the guys behind the basic skills dataset I mentioned earlier have also provided a justification for ranking China at 107:
Deriving estimates of skill deficits for China is more difficult and uncertain. Only the highest income cities and provinces of China have participated in PISA: Beijing, Shanghai, Jiangsu, and Zhejiang (often labeled BSJZ) and Guangdong in varying combinations between 2012 and 2018. A number of commentators have concluded that these are not representative of China as a whole (see, for example, Loveless (2014), Schneider (2019), and Gruijters (2020)).
Our base calculations begin with the PISA score distribution of BSJZ for 2018. For our main estimates, we re-weight the observed four-province distribution using data from the 2014 wave of the China Family Panel Studies (CFPS). The CFPS contains nationally representative data for 25 of the 31 provincial-level administrative divisions in China. The child questionnaire includes children aged 10 to 15 and assesses their cognitive ability in math by a crude ability test that is not psychometrically scaled. Each child can score between 0 and 24, although there is little variation in scores near the bottom of the distribution. The score corresponds to the question number of the most difficult problem that the student answered correctly.
We estimate the national PISA score distribution by re-weighting the BSJZ distribution according to the national distribution of CFPS scores. From the percentile distribution of CFPS scores in BSJZ, we calculate the corresponding PISA scores for each point of the CFPS test distribution, i.e., 1, 2,..24 BSJZ PISA for κ κ = . We then find the corresponding proportion of students nationally that score at each point of the CFPS distribution. However, the conversion is highly unreliable at the relevant basic-skill threshold because only few students in the BSJZ provinces fall below the PISA basic skill level (2.2 percent) and because the CFPS test has very little support at this level. The estimate implies that just 3.2 percent of the Chinese national student population perform below the basic skill threshold.
We can also use the re-weighted CFPS distribution to estimate national mean achievement:
This re-weighting yields an estimate of the national average PISA score of 553.1, down from 591.4 for the four tested provinces. As discussed further in section 4.2 below, these estimates are quite inconsistent with other studies on student learning in rural China. Unfortunately, no other assessments are available for all of China which would allow to adjust the four provincial distributions. As the transformation using the CFPS dataset is potentially unreliable, in our sensitivity analysis we use information from other East Asian countries to bound the Chinese national skill deficit and to show how this affects the estimate of the global skill deficit.
This is a much more accurate method - they use actual cognitive data from about 25 provinces to reweigh the sample. This re-weighting yields an estimate of the national average PISA score of 553.1, a decrease from the 591.4 score of the four tested provinces. This translates to an IQ of 107.5 relative to the UK, or 104.8 relative to US Whites.
The cognitive data from the provinces they gathered comes from the Chinese equivalent of the NLSY - the CFPS, which is a public dataset. This means the data is also unlikely to be fraudulent, as it yields results you would expect from legitimate data.
Cognitive testing data
For an iodine study, China underwent extensive cognitive testing, where 38000 individuals took a Ravens test in order to determine if iodine deficiency caused IQ decline. These results suggested an average IQ of 103.4, roughly in line with most estimates generated from cognitive testing. (edit: I was told in a groupchat that these are country corrected and done on Chinese norms, so they can’t be compared internationally. This does check out with Becker’s study table)
They also correlate robustly with results generated from an online IQ test, regional average years of education, and GDP per capita, suggesting that they are probably not falsified.

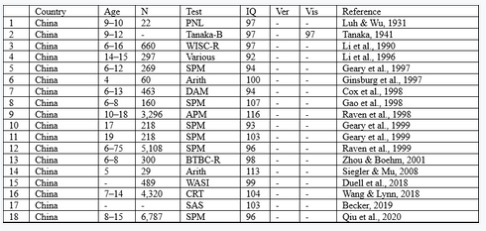
David Becker also posts the studies he uses to calculate national IQs, 8 of which are used to calculate China’s IQ:
Among these I count:
Study 1: a possibly p-hacked study using 750 Chinese undergrad students. The science students did score higher than the art students on the ravens, but parental education was not associated with score. Maybe legit, maybe not. Hard to tell. The students were also tested quite a long time after the test was normed, so a large adjustment had to be made, making these results less plausible - an IQ of 94 for Chinese college students seems rather low to me.
Study 2: a study which uses the iodine study data. Becker doesn’t seem to think it’s high quality, for whatever reason.
Study 3 and 4: data from a WISC standardization.
Studies 5-8: data from the raven’s manual.
Most of these sources seem to be fairly reliable, though I wouldn’t be surprised if one of them was fraudulent (particularly the first one).
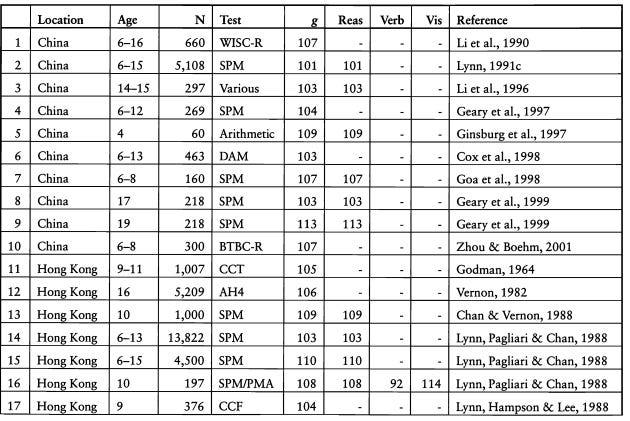
Richard Lynn’s book race differences in intelligence also contains some estimates that test the IQs of Chinese people. All of the samples are above 100, consistent with Becker’s data.
Other evidence China has a high IQ
Age Heaping
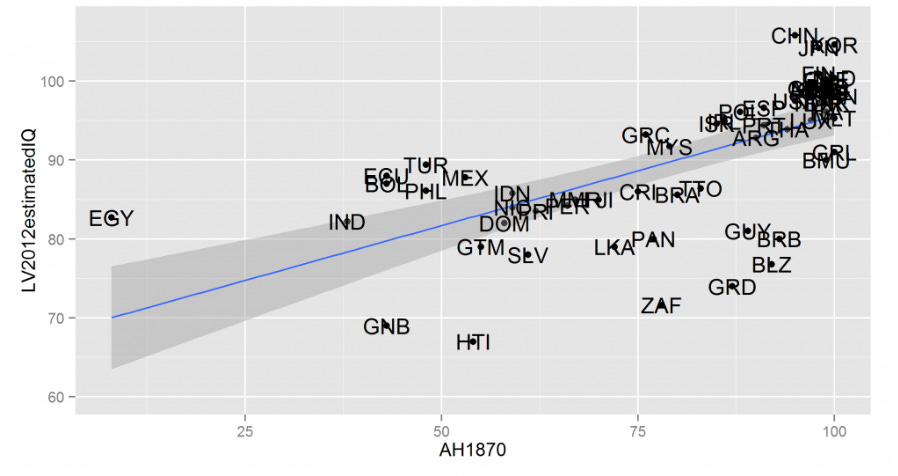
Older humans often rounded ages to the nearest 5 or 10, resulting in an abundance of death records reflecting ages like 30, 35, and so on. This is called age heaping, and the rate at which people avoid age heaping correlates with IQ.
China was among the 10 of 107 countries that engaged in the least age heaping in 1890. Landing in the top 10 of IQ translates to a national IQ between 99 and 105, consistent with the cognitive testing data.
Ethnicity
91% of Chinese are Han Chinese - given that race is genetically associated with cognitive ability, so a representative sample of these individuals should be very representative of China as a whole.
IQ of Chinese abroad
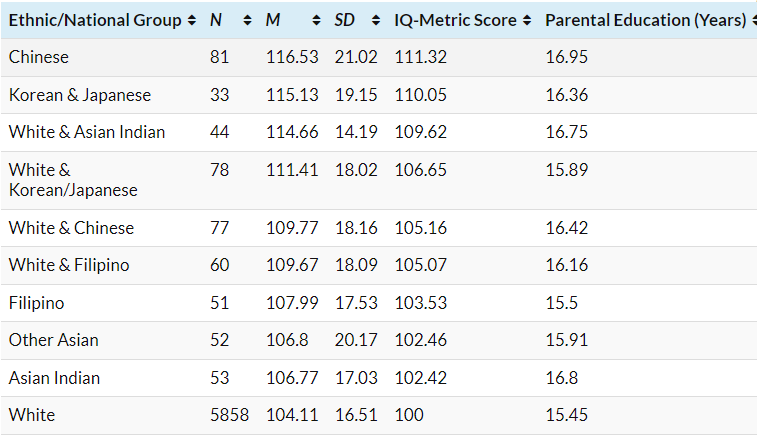
When compared to Whites, modern Chinese-American children score the equivalent of a 111 (n = 81) in IQ. Richard Lynn also has studies which test the Chinese, most of which suggest an average IQ of 95-105 in older samples.
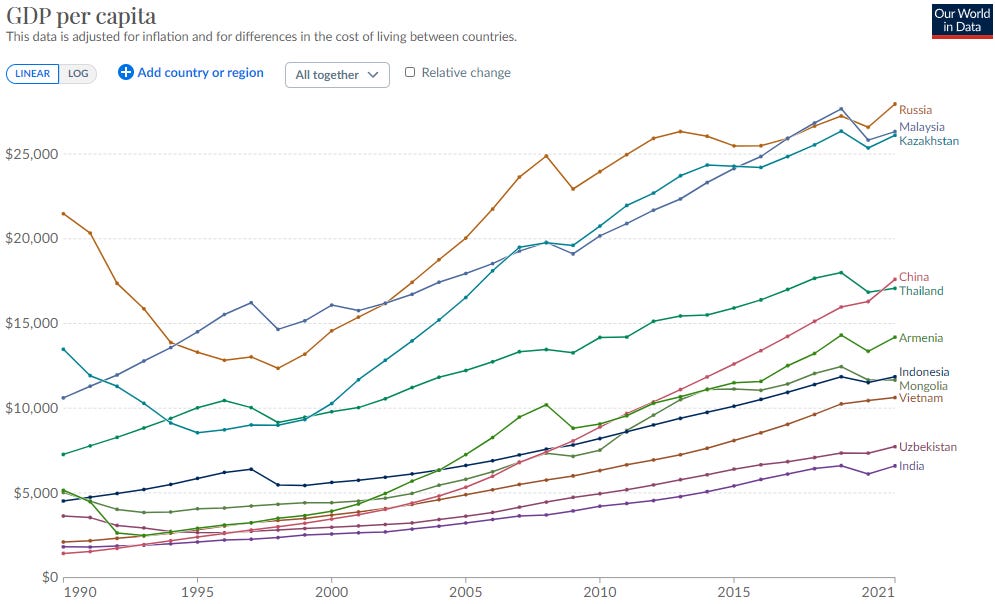
Decent economic growth
In comparison to other countries in the region, China started as the poorest and has finished somewhere in the middle of all of them. Given that economic growth correlates highly with national IQ, this means that China is probably highly intelligent.
V2
I received some criticisms of this post on a private channel, so I decided to revisit my assessment of China’s national IQ. The critic doesn’t have a “public identity”, so I decided to screen out his name when posting his messages.
My critic adjusted the Lynn studies for an assumed difference between Chinese in Shanghai/Beijing and the rest of the mainland by 9-10 points, leading to a median estimate of 97.5 for all of China.
To summarize, he claims that after adjusting for elite sampling in Lynn’s studies, the IQ of China was estimated to be close to the European average (97.5).
It would also be possible to do the same for the Chinese PISA results. 4 provinces have had their scores publicized in the 2018 PISA results, and those are Beijing, Shanghai, Jiangsu, and Zheijang. These provinces scored .69 SD above the US White mean according to Steve Sailer, which translates to a national IQ of 110.35. If the national averages for each provinces are known, then it is possible to estimate China’s IQ mathematically.
This can be done either using:
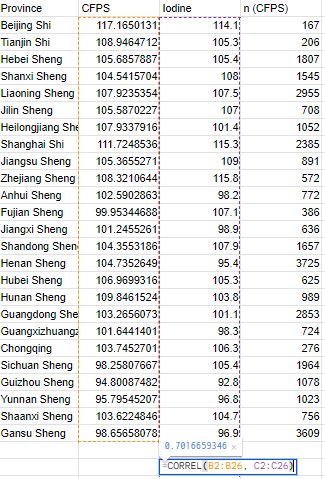
The CFPS, which has data on IQ and province of birth
The Chinese Iodine study
I had previously run into issues analyzing the CFPS, though I have reason to believe these results I gathered from it are legitimate, as they correspond reasonably closely with the results from the Iodine study:
These 4 countries performed about 6.64 [(113.17+107.72+104.32+101.37)/4] (note - the CFPS results are arbitrarily normed at 104) points above the national average - subtracting 6.64 from the PISA estimate of 110.35 results in an estimate of 103.75. The people behind the basic skills dataset did roughly the same thing and came to an estimate of about 104.8.
This is an overestimate, as western Chinese provinces are not properly represented in this sample, so the difference between B-S-J-Z and the other provinces is deflated.
The same can be done using the IQ estimates from Iodine study, which samples Chinese provinces in a more representative fashion. In the Iodine study, B-S-J-Z scored 9.8 points above the national mean [(114.1+115.3+115.8+109)/4-103.75], leading to a national IQ estimate of 100.55.
Overall, the true mean IQ of China is probably close to 102 or so, when you consider the northeast-southwest genetic cline and the fact that China is not as developed as other East Asian nations. While it is unclear whether differences in parental resources/status cause differences in intelligence in western countries, between countries they are clearly a causal factor. Sub-Saharan Africa has a measured IQ of about 70 and Black Americans have an IQ of about 85 - a difference of 15 points, only about 4 of which can be explained by admixture alone, as American Blacks ~20% European.
Other reasons to believe the Chinese IQ is close to Japan and Korea:
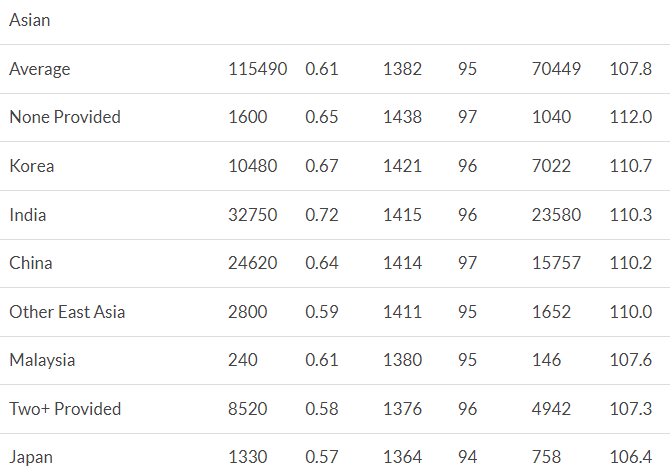
Chinese Americans get similar SAT/ACT scores to other Asian Americans:
This applies to IQ as well, though the sample sizes are not as good.
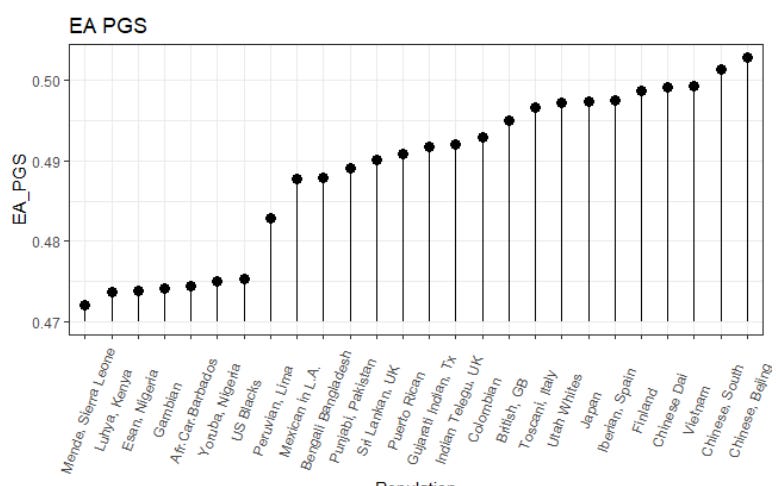
They have high polygenic scores for educational attainment as well as other asians, though their 1000 genome samples are not particularly representative (I’m surprised this article has not caught on!).
The PISA scores of regions who hadn’t had their data published were also leaked, that suggested that the country performed about as well as a smart European country.









Debate krichard1212 on IQ
> China was among the 10 of 107 countries that engaged in the least age heaping in 1890.
Don't disagree with overall thesis, but this isn't great evidence. Chinese heap differently - by 12 year intervals of the Chinese calendar.