

Version 3
Methodology: a total of 5,645 means were compiled into the meta-analysis, most drawing from Becker’s dataset, PISA, PIRLS, TIMSS, the working memory meta-analysis, and the harmonised learning outcomes.
These means were classified into three categories: international scholastic tests, IQ samples (from Becker’s dataset + some other sources), and the samples from the working memory meta.
The IQ samples were adjusted for the effect of perceived selectivity (e.g. college students or white collar workers would be highly selected samples, janitors would be negatively selected) and location (urban, rural, national, etc). All samples were age-normed prior to the conduction of statistical analysis.
The memory samples were adjusted for the age of testing, year, perceived selectivity, and the type of test (e.g. forward span vs backward span). The standard deviations for these variables also had to be adjusted for these factors. IQs were then calculated using these means and standard deviations. The quality of these averages was nothing short of awful, despite my best efforts; according to the model, some of the samples had average IQs as high as 150 and as low as 40.
Then, all of the samples were combined into one file and subject to an anchoring process which controls all of the samples for bias at the category level. For example, if the PISA math test from 2008 gives scores 20 points higher in comparison to what would be expected from the set of tested countries, the scores were adjusted downwards by 20 points. The reference group (IQ = 100) is white Britons.
I then grouped the tests into six different categories: PIRLS, TIMSS, memory, PISA, IQ, and all other tests (other). I gave weights of 3 to the PIRLS, TIMSS, PISA, and ‘other’ averages, a weight of 2 to the IQ averages, and a weight of 1 to the memory averages. No manual revisions were made and I refused to impute the IQs of Turkmenistan, Guyana, Suriname, and French Guinea with proxies like performance in the IMO.
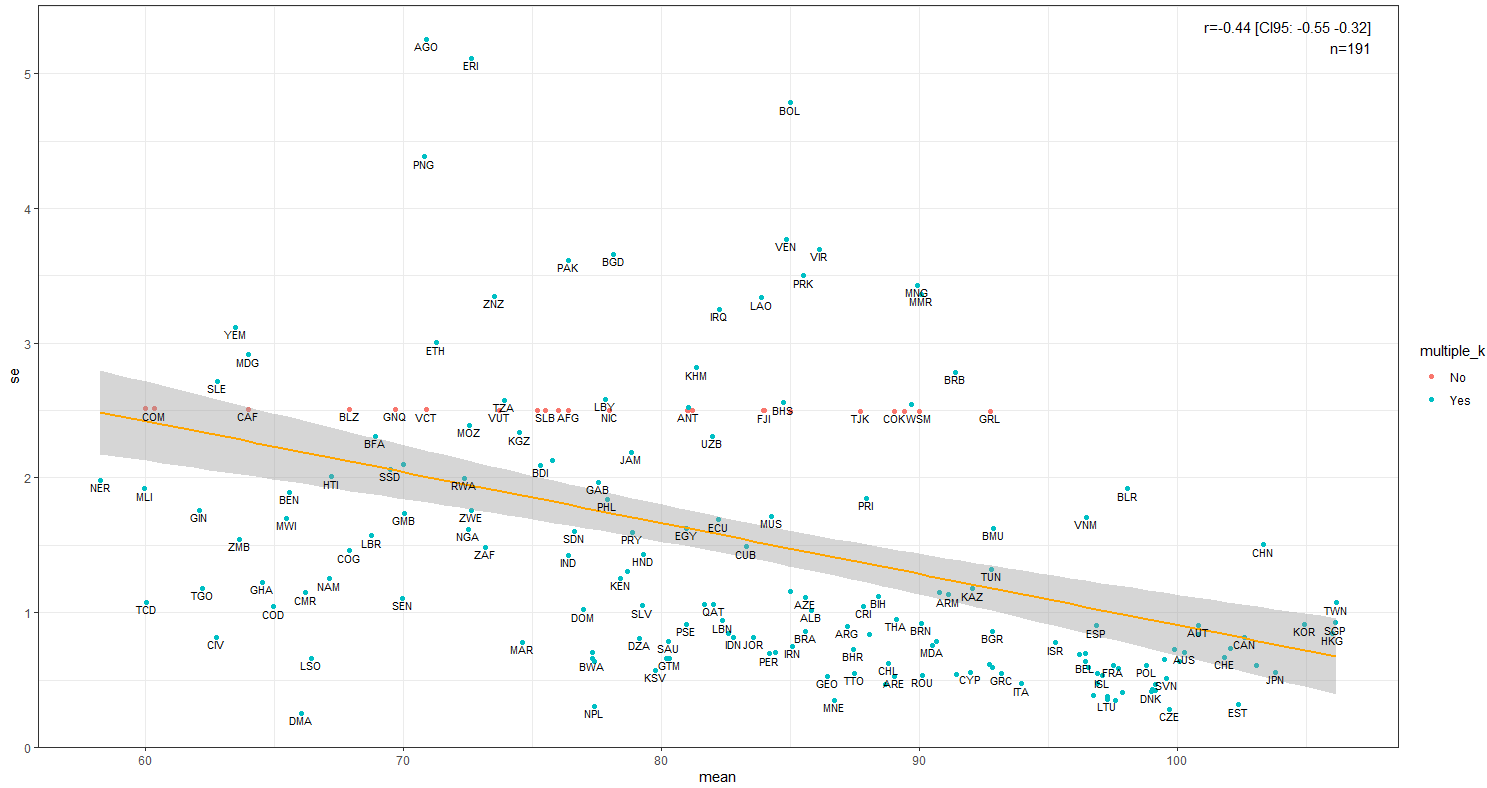
I also calculated the standard errors of these estimates by taking the standard deviation of the sample means and dividing it by the square root of the number of them1. Countries with only one sample had their standard errors estimated based on the observed relationship between number of samples and standard error:
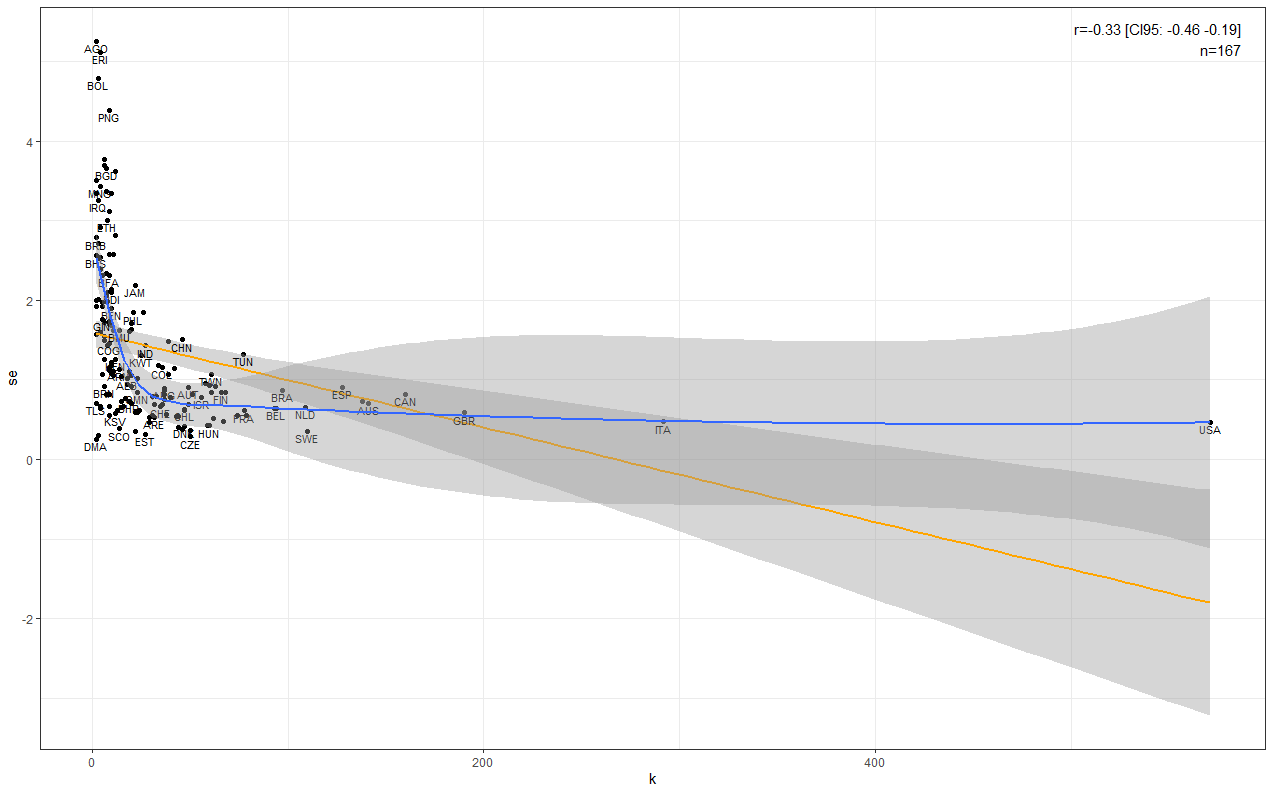
On average, each country had a standard error of 1.53. This is a 41% improvement from the prior dataset (V2) which had an estimated average standard error of 2.58.
National IQ FAQ
Do IQ tests have a regional bias?
I reviewed the literature in this preprint and couldn’t come to a definitive conclusion. There is one study (Wicherts’, I believe) that found that GPA and IQ were less correlated in Africa than they were in Europe, but that could also be an artefact of worse grading. Most of the tools traditionally used to assess bias (differential item testing, comparing g-loadings across groups) find little evidence of bias, but I personally don’t think these methods work well.
When it comes to bias testing, the golden standard is taking variables that are assumed to be racially unbiased (e.g. education, income), regressing those onto IQ between groups, and observing if the slopes/intercepts differ to a practical/statistical extent. To my knowledge, there has been no attempt to do this across countries.
Speaking clearly, I think the largest issue with comparing cognitive tests across countries are education and effort. Education causes people’s IQ scores to increase because they become more familiar with standardised testing and improve their skills in maths/reading, but don’t actually get more intelligent. As such, more educated countries should have higher IQ scores that are not reflective of superior general intelligence. Some people have theories that IQ tests are biased by effort across countries, but I don’t see much evidence for this; empirical attempts to assess the question have found the opposite (check the appendix of said paper).
Alternatively, one could argue that there are factors that shrink the observed averages, like using between group standard deviations and imperfectly g-loaded tests. Overall, I would guess that the differences between countries are slightly inflated.
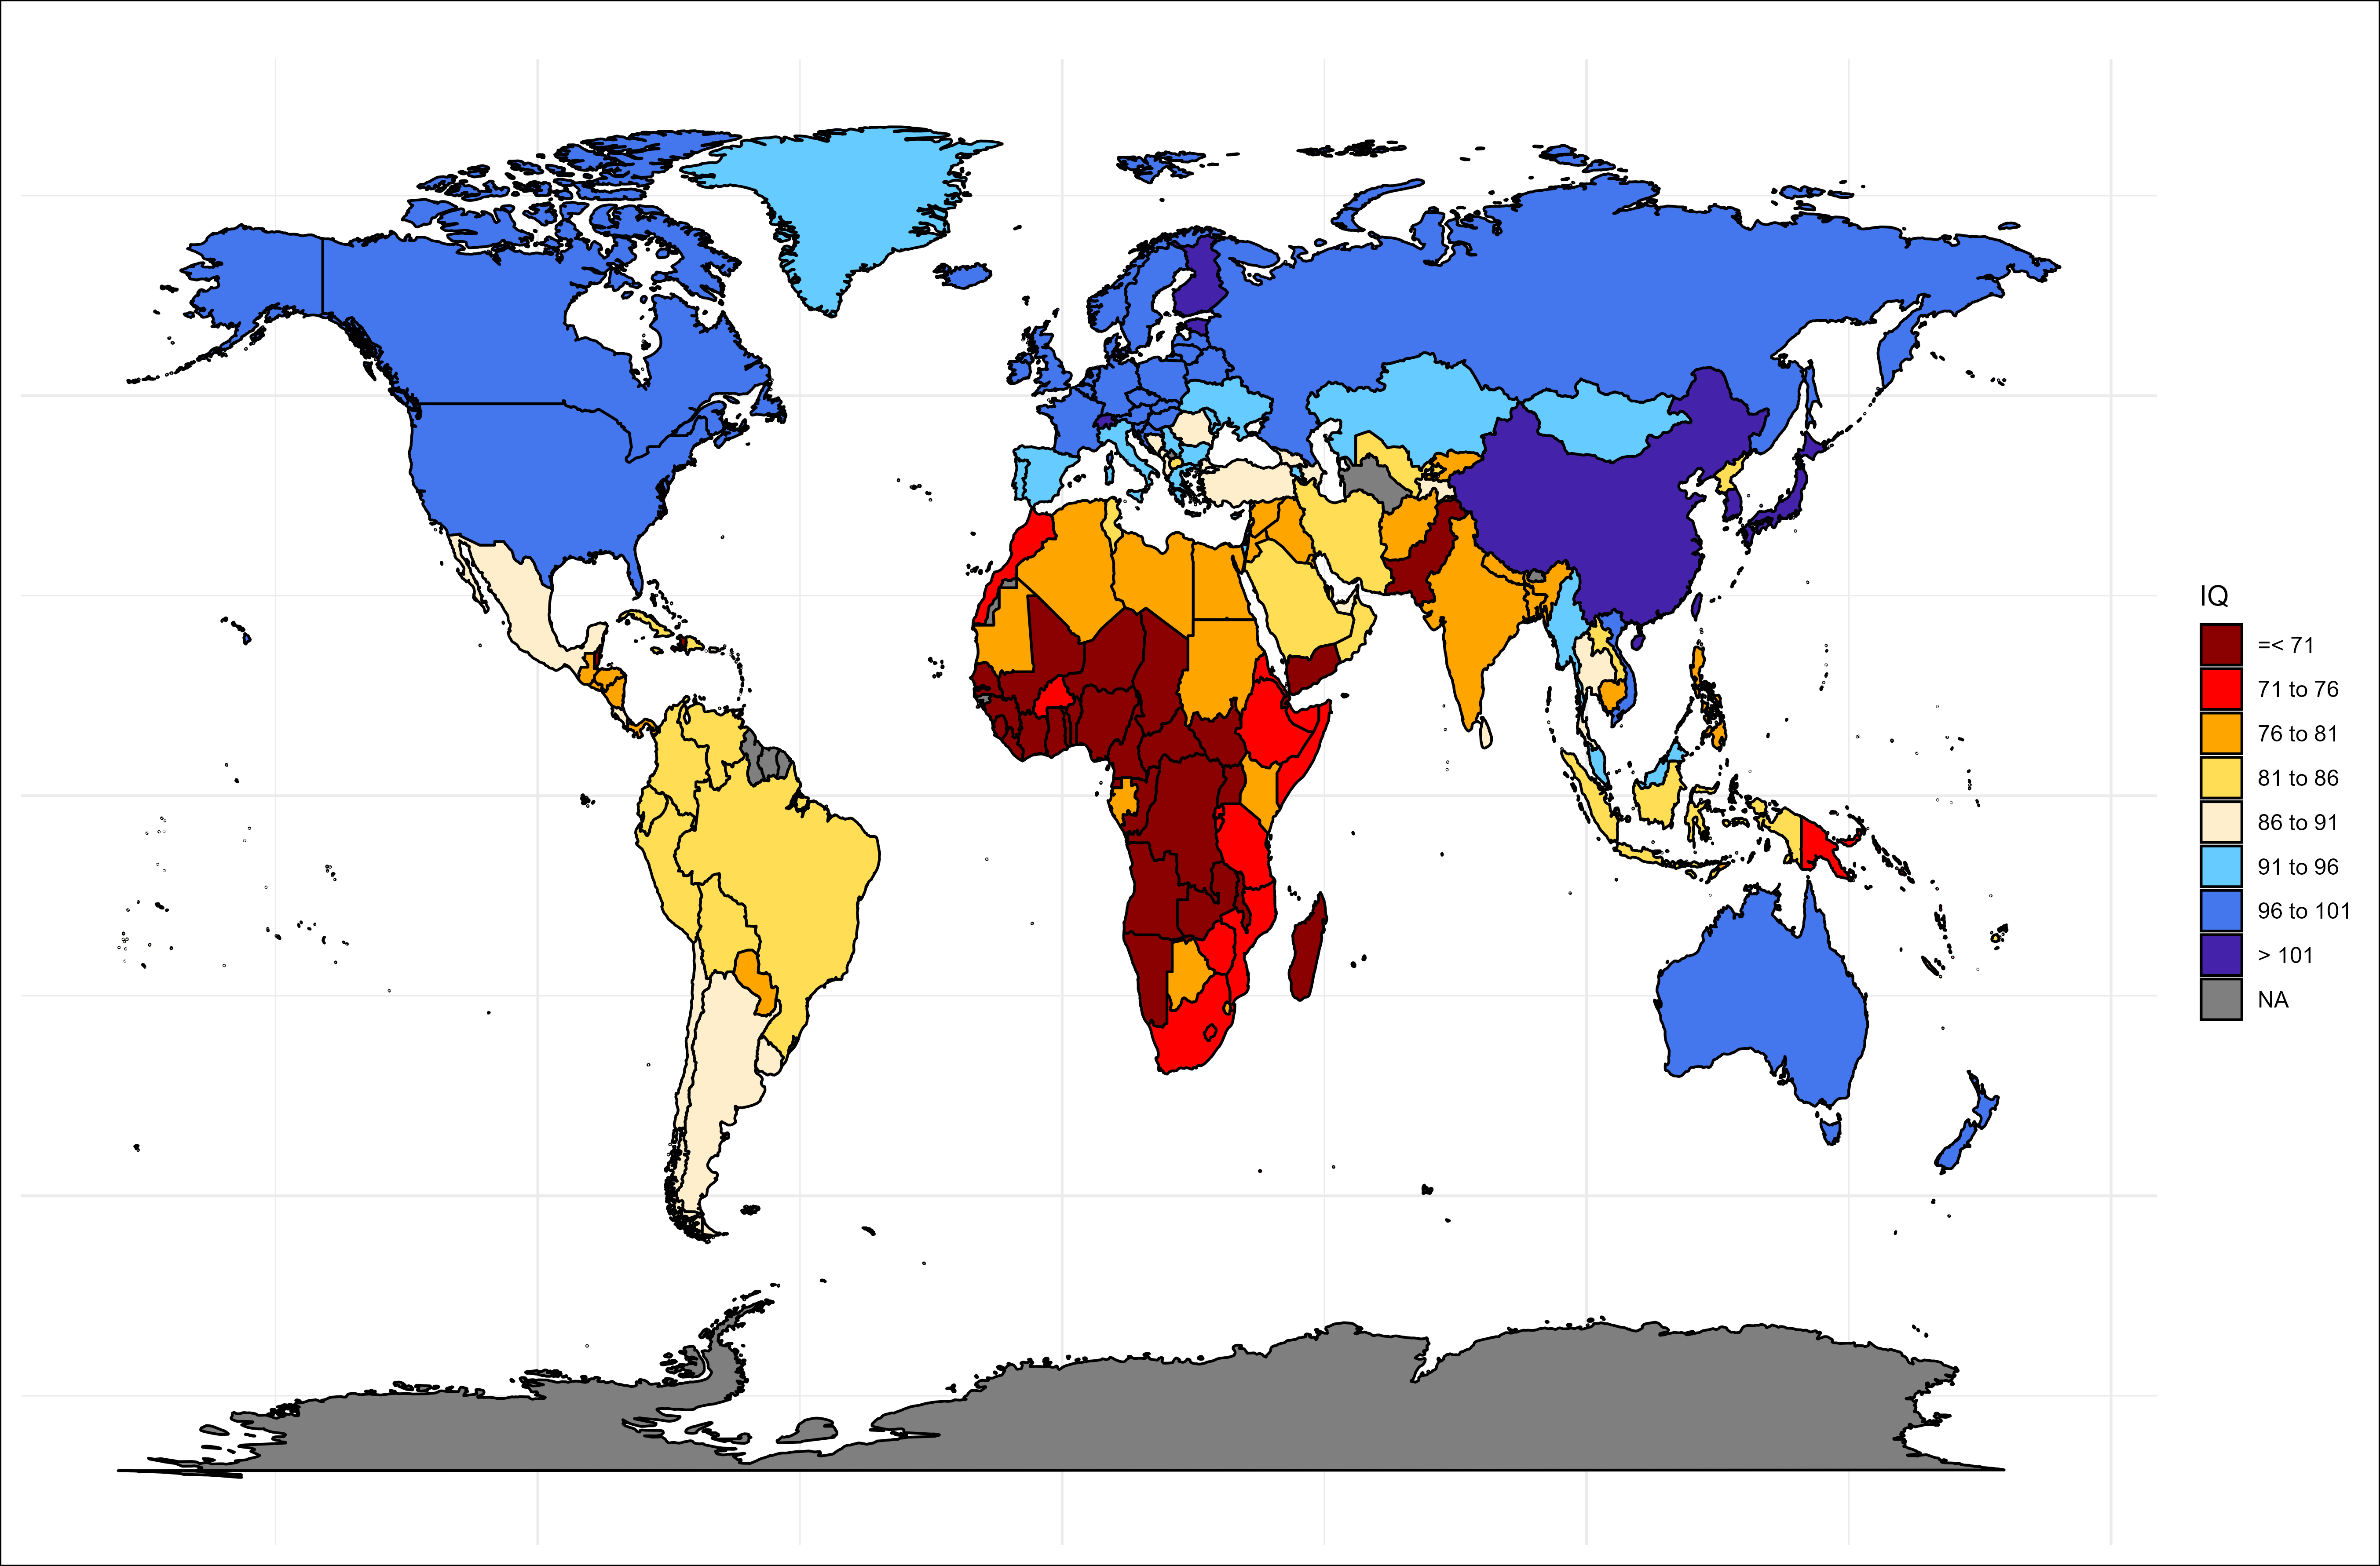
Is the average IQ in Sub-Saharan Africa really 70?
More or less. The score is reflective of their ability to take cognitive tests. An IQ of 70 is commonly used as a cutoff for intellectual disability in the United States, but I should note that this is not a hard cutoff and there is general agreement that IQ alone cannot be used to diagnose intellectual disability. I suspect that, controlling for education and measurement invariance, the true IQ of Sub-Saharan Africa is closer to 75.
Is the average IQ in China really 101?
The average is inflated by several points because Eastern provinces and urban areas are oversampled. A nationally representative sample of China would probably score somewhere between 95 and 100.
How much does biased collection play a role in the differences across countries?
Almost none. Lynn made some mistakes in the collection of the data but he was making an honest effort from what can be inferred.
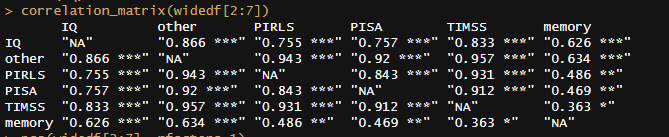
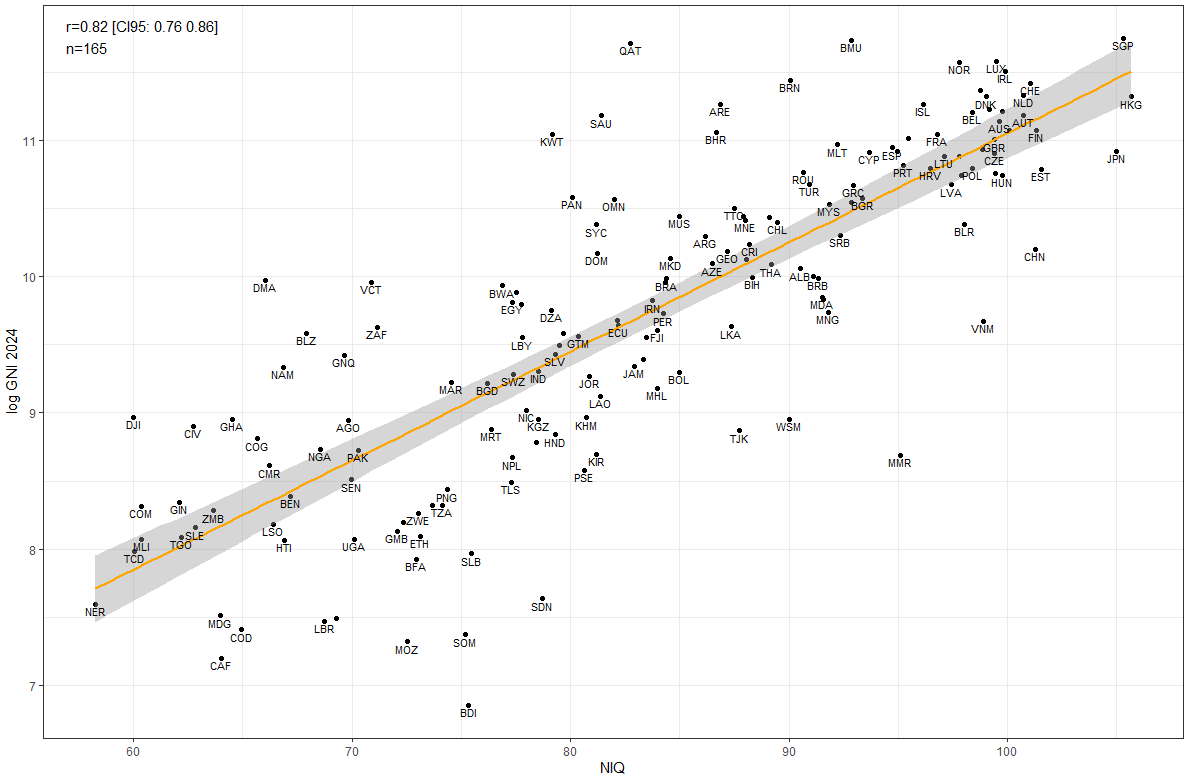
About half of the data come from international scholastic assessments that take (roughly) representative samples of students and compare them in terms of their ability. Despite the samples being massive and the data collection being conducted by an independent body, the scores on these tests correlate reasonably well with the ones found in IQ tests:

Are any of these values based on geographical imputations?
No.
Do you have any concerns with the estimates of specific countries?
I think that China probably has an IQ in the upper 90s, Mynamar in the mid 80s, Kazakhstan in the upper 80s, and North Korea in the low 90s.
I think the North Korean IQ is deflated by sampling refugees who live in South Korea and I think the Chinese IQ is inflated because Eastern provinces higher in intelligence are disproportionately sampled. I don’t have any specific comments on the others but they seem to be at odds with their levels of development and cultural prominence.
V3 Appendix:
Average IQ by region:
region                          mean_IQ
   <chr>                             <dbl>
 1 Eastern Asia                     99.823
 2 Western Europe                   99.794
 3 Northern Europe                  98.801
 4 Australia and New Zealand        98.721
 5 Northern America                 96.111
 6 Eastern Europe                   96.004
 7 Southern Europe                  91.588
 8 South-eastern Asia               88.311
 9 Polynesia                        86.841
10 Central Asia                     85.608
11 Western Asia                     83.863
12 Micronesia                       82.047
13 Latin America and the Caribbean  82.007
14 Southern Asia                    78.556
15 Melanesia                        78.513
16 Northern Africa                  78.503
17 Sub-Saharan Africa               69.308
Values:
alpha3     NIQ    se
    <chr>    <dbl> <dbl>
  1 HKG    105.689 0.846
  2 SGP    105.317 0.923
  3 JPN    104.964 0.556
  4 TWN    104.87  1.073
  5 KOR    103.27  0.915
  6 LIE    102.05  0.734
  7 EST    101.553 0.315
  8 FIN    101.335 0.838
  9 CHN    101.286 1.503
 10 MAC    101.206 0.61
 11 CHE    101.055 0.669
 12 AUT    100.735 0.905
 13 NLD    100.724 0.654
 14 CAN    100.106 0.817
 15 IRL     99.923 0.637
 16 HUN     99.791 0.422
 17 SWE     99.778 0.348
 18 AUS     99.619 0.703
 19 LUX     99.479 0.594
 20 RUS     99.432 0.431
 21 GBR     99.406 0.584
 22 CZE     99.396 0.283
 23 DEU     99.152 0.724
 24 DNK     99.025 0.414
 25 VNM     98.904 1.706
 26 SVN     98.841 0.513
 27 USA     98.77  0.465
 28 POL     98.398 0.611
 29 BEL     98.38  0.641
 30 BLR     98.035 1.918
 31 SVK     97.884 0.381
 32 NZL     97.823 0.546
 33 NOR     97.804 0.472
 34 LVA     97.423 0.407
 35 SCO     97.308 0.384
 36 LTU     97.123 0.358
 37 FRA     96.774 0.609
 38 HRV     96.464 0.696
 39 ISL     96.14  0.531
 40 ITA     95.478 0.471
 41 PRT     95.223 0.691
 42 MMR     95.079 3.362
 43 ISR     94.981 0.776
 44 ESP     94.733 0.902
 45 CYP     93.698 0.559
 46 BGR     93.345 0.864
 47 GRC     92.931 0.551
 48 KAZ     92.868 1.177
 49 BMU     92.844 1.624
 50 GRL     92.725 2.491
 51 SRB     92.354 1.147
 52 MLT     92.233 0.595
 53 MYS     91.854 0.788
 54 MNG     91.801 3.429
 55 UKR     91.572 0.613
 56 MDA     91.524 0.76
 57 BRB     91.365 2.785
 58 ARM     91.097 1.132
 59 TUR     90.913 0.544
 60 ROU     90.664 0.534
 61 ALB     90.51  1.015
 62 BRN     90.06  0.92
 63 WSM     90     2.493
 64 CHL     89.46  0.625
 65 TCA     89.4   2.494
 66 THA     89.181 0.949
 67 URY     89.088 0.464
 68 COK     89     2.494
 69 BIH     88.339 1.122
 70 CRI     88.19  1.048
 71 MEX     88.046 0.839
 72 MNE     88     0.351
 73 PRI     87.93  1.849
 74 TJK     87.71  2.495
 75 TTO     87.523 0.547
 76 LKA     87.375 2.541
 77 GEO     87.199 0.526
 78 ARE     86.866 0.526
 79 BHR     86.7   0.727
 80 AZE     86.512 1.111
 81 ARG     86.172 0.897
 82 VIR     86.1   3.695
 83 VEN     85.802 3.771
 84 PRK     85.5   3.5
 85 NCL     85     2.496
 86 MUS     84.978 1.716
 87 BOL     84.97  4.784
 88 BHS     84.733 2.557
 89 MKD     84.587 0.705
 90 BRA     84.389 0.864
 91 COL     84.365 1.157
 92 PER     84.265 0.694
 93 FJI     84     2.497
 94 MHL     83.96  2.497
 95 IRN     83.751 0.752
 96 TUN     83.486 1.322
 97 UZB     83.321 2.307
 98 JAM     82.915 2.188
 99 QAT     82.755 1.064
100 CUB     82.507 1.489
101 ECU     82.209 1.688
102 IDN     82.162 0.816
103 OMN     82.026 0.845
104 LBN     81.966 0.94
105 TON     81.522 2.52
106 SAU     81.421 0.787
107 LAO     81.35  3.336
108 DOM     81.23  1.02
109 SYC     81.198 1.061
110 KIR     81.18  2.499
111 ANT     81.035 2.499
112 MNP     81     2.499
113 KSV     80.954 0.573
114 JOR     80.884 0.815
115 KHM     80.729 2.817
116 PSE     80.63  0.912
117 GTM     80.366 0.663
118 PAN     80.087 0.66
119 IRQ     79.664 3.252
120 PHL     79.475 1.841
121 SLV     79.326 1.051
122 HND     79.29  1.433
123 KWT     79.162 1.305
124 DZA     79.134 0.811
125 SDN     78.713 1.604
126 KGZ     78.535 2.334
127 IND     78.533 1.428
128 KEN     78.456 1.253
129 SYR     78.222 2.132
130 NIC     77.966 2.501
131 LBY     77.812 2.58
132 PRY     77.764 1.595
133 GAB     77.537 1.97
134 SWZ     77.407 0.635
135 NPL     77.332 0.303
136 EGY     77.331 1.627
137 TLS     77.304 0.702
138 BWA     76.902 0.657
139 AFG     76.4   2.502
140 MRT     76.4   2.502
141 BGD     76.188 3.66
142 CYM     76     2.502
143 SLB     75.486 2.502
144 BDI     75.312 2.094
145 SOM     75.202 2.503
146 MAR     74.541 0.781
147 PNG     74.381 4.383
148 TZA     74.15  2.578
149 VUT     73.695 2.504
150 ZNZ     73.537 3.345
151 ETH     73.141 3.002
152 ZWE     73.024 1.761
153 BFA     72.936 2.31
154 ERI     72.619 5.112
155 MOZ     72.547 2.391
156 RWA     72.367 1.998
157 GMB     72.063 1.734
158 ZAF     71.156 1.485
159 VCT     70.88  2.505
160 PAK     70.311 3.617
161 UGA     70.099 2.101
162 SEN     69.972 1.108
163 AGO     69.817 5.257
164 GNQ     69.667 2.506
165 MWI     69.269 1.7
166 SSD     68.818 2.062
167 LBR     68.757 1.57
168 NGA     68.535 1.617
169 BLZ     67.914 2.507
170 BEN     67.181 1.894
171 HTI     66.902 2.008
172 NAM     66.873 1.252
173 LSO     66.423 0.662
174 CMR     66.199 1.147
175 DMA     66.04  0.25
176 COG     65.653 1.459
177 COD     64.951 1.042
178 YEM     64.839 3.115
179 GHA     64.516 1.224
180 CAF     64     2.51
181 MDG     63.983 2.912
182 ZMB     63.654 1.541
183 SLE     62.818 2.718
184 CIV     62.755 0.815
185 TGO     62.21  1.179
186 GIN     62.094 1.757
187 COM     60.355 2.512
188 MLI     60.348 1.919
189 TCD     60.046 1.076
190 DJI     60     2.512
191 NER     58.249 1.981
Correlation matrix:
Sample mean and estimated standard error:
Correlation between GDP per capita (IMF data, PPP controlled) and IQ:
World IQ: 85.8

Link to dataset (it’s the last file).
Version 2
White British mean/SD set to 500/100.

Methodology: composite of various datasets. Paper will be out in a few months.
Preprint is now out!
World IQ: 85.6 weighted by population

Technically this estimates the standard error of the mean of all samples (not weighted subcategories), though I thought that this standard error would be a better estimate of the error in the estimates than the one that would be calculated from the subcategories.
Better is to predict many external outcomes and average across them to find the best set of estimates. This is best on the assumption that maximizing reliability and construct validity will maximizing predictive validity. I suggest you download the SPI and use the indicators as your outcomes. Average across them (remember to use absolute values, or reverse by the S factor loading), and see which set does the best. https://www.socialprogress.org/
National IQ have been my main obsession for the last few days. Spending countless of hours. Figuring out the correct numbers etc.
Thank you for this beautiful post seb. This feels like Christmas