Stereotypes tend to be accurate: the average ratings of groups correlate at about .5 to .8 with objectively measured data, so conservatives being fat should be considered the null hypothesis, but one still worth testing. On a county level, Republican counties appear to be more likely to be obese.
Formal statistical analyses that study the association between support for Romney and obesity at a county level do confirm the link, even when controlling for education, poverty, and racial demographics.
Even with this data, the stereotype is not confirmed, as individual and group level effects can go in different directions, and there could be omitted variables that regressions are not able to account for. Therefore, it would be best to test this hypothesis at an individual level.
Unfortunately, I could only find one study that used that methodology
Daley, A.J., Roalfe, A.K. & Bleich, S.N. Political voting in the United Kingdom 2019 general election and risk of living with obesity in a nationally representative sample. Int J Obes 48, 1430–1437 (2024). https://doi.org/10.1038/s41366-024-01569-5
2668/4000 (67%) of invitees provided data, 95/2668 (3.5%) were not eligible to vote, with the remaining 2573 (96.5%) included. Conservative Party voters were more likely to be living with obesity than those who voted Labour (OR:1.42 95% CI (1.01–1.99)) or Liberal Democrats (1.54 95% CI (1.00–2.37)). Conservative Party voters on average had significantly higher BMI scores than those voting Labour and Liberal Democrats; BMI mean difference 0.88 points (95% CI: 0.16–1.61) between Conservative and Labour voters, and 1.04 points (95% CI: 0.07–2.02) between Conservatives and Liberal Democrats voters. There was no evidence participants living in constituencies won by Conservative MPs were more likely to be living with obesity than constituencies won by other party MPs.
The comparison between labour (the left wing party) and the conservatives (the right wing party) does align with priors, but does not pass significance testing when no covariates are adjusted for.
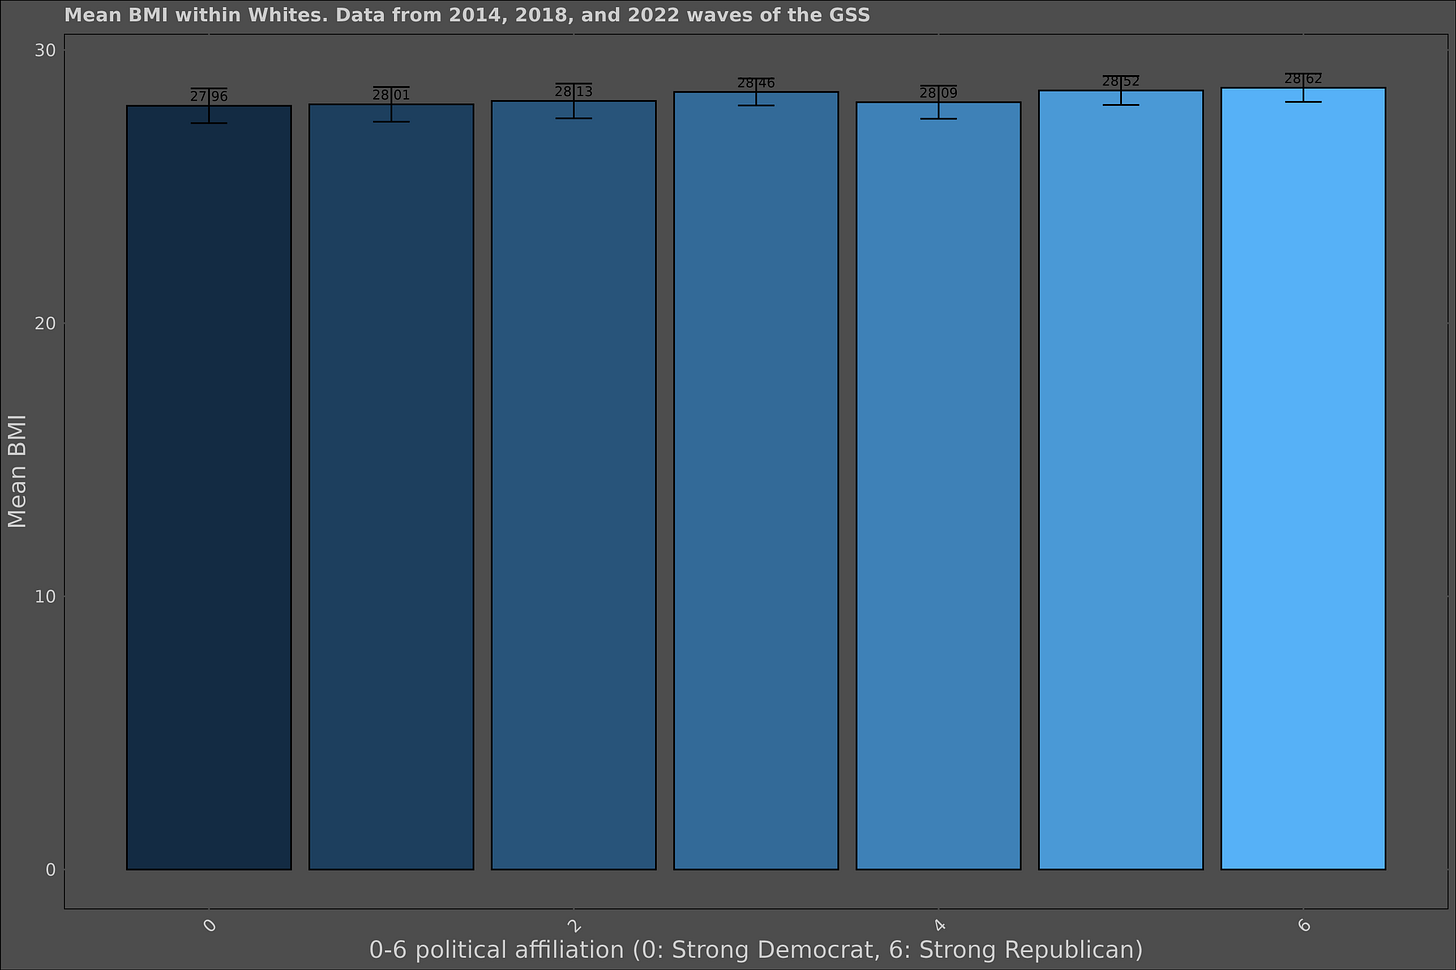
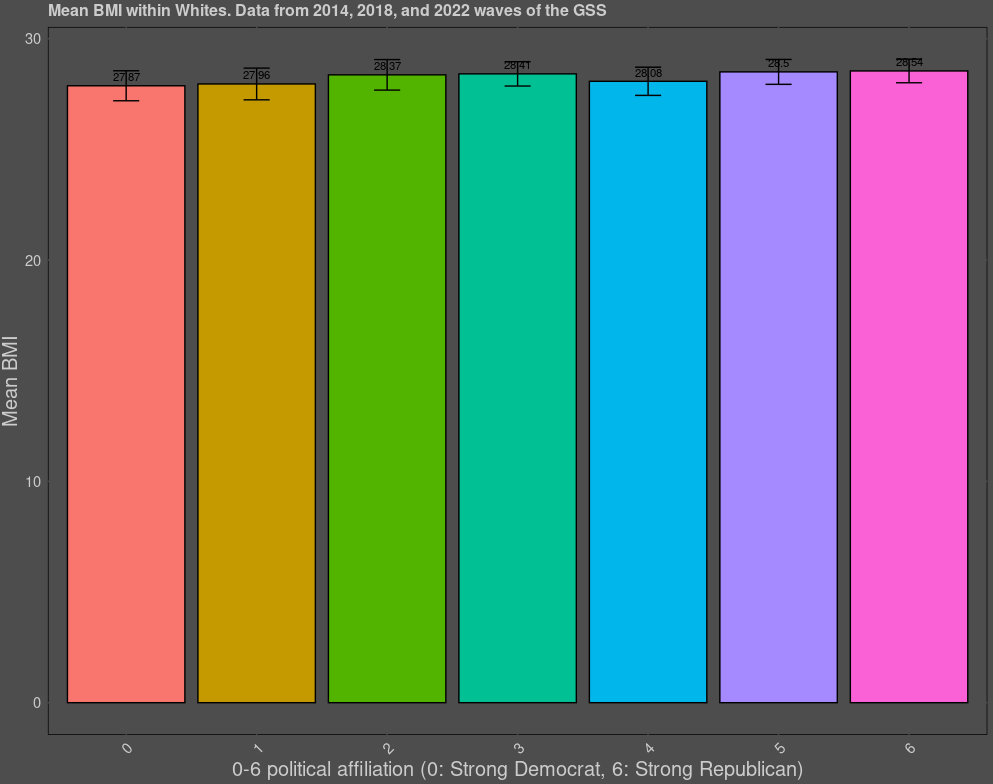
I was unable to find any other studies or even blogposts that try to tackle this question, so I tested for the effect in the GSS using self-reported height and weight, and found more or less the same result: Republicans had BMIs about 0.4 points higher than Democrats, but the correlation between the two variables (r = .03) is extremely small and not even statistically significant (p = .07) in the total sample of 3186 individuals.
It’s unlikely that the self-reported measurements of height and weight are biased, as these correlate with real data at above 0.9. Taking for granted that right wingers are more muscular than left wingers, BMI will be biased against the right as a measurement of obesity, so even if an association were to be found, it’s not clear whether the slightly higher BMIs of conservative voters are reflective of higher levels of fat or muscle.
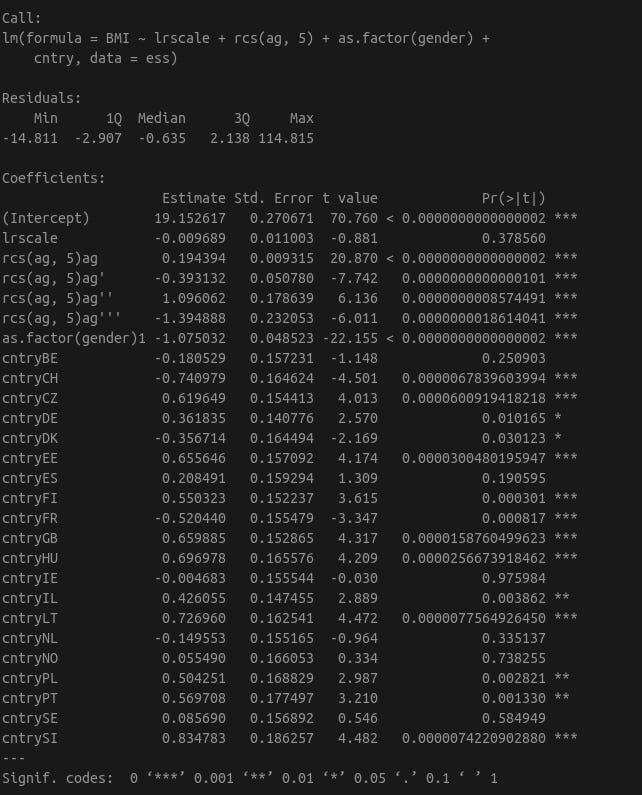
For the sake of rigour, the association was tested within the European Social Survey, which has a much larger sample (n = 38,872 with no missing data for BMI), so it is better suited for analyzing this question. No correlation between political views and obesity could be found (r = -0.0016, p = .77).
Independent of the mean, the distribution of BMI does not vary by politics either.

Controlling for variables is not appropriate here, as what is being tested is an assoication, not an effect; regardless, controlling for country of residence, age (using a spline), and gender did not change the results.
Why fat Republicans?
While stereotypes are not always accurate, they are not random; people didn’t randomly decide to think right wingers are fat, there had to be some kind of cultural or social reason as to why the stereotype emerged. One could think that because institutional media organizations tend to be left wing, that they are able to successfully smear right wingers as overweight. The issue is that stereotypes about political views are otherwise accurate and does not explain why weight specifically is the outlier here. There are also positive stereotypes about right wingers, such as greater levels of mental stability, which fits the media model poorly.
The more plausible cause of this stereotype is that beliefs about Americans and right wingers are confounded due to the fact that American patriotism is right wing coded. This effect is able to explain various false stereotypes: that Americans and right wingers are unintelligent, despite the fact that the national IQ of the USA is competitive with that of Europe and that the American right, as late as 2008, was still more intelligent than the left. Although Americans are generally thought of as right wing, it’s not clear whether this is actually the case: Europeans are more right wing on immigration and abortion, but less so when it comes to economic issues or beliefs about climate change. Overall, I would say that Americans are more right wing, though the confounding model does predict that this stereotype would emerge.
Feel free to plagiarize the statistical analyses; I don’t intend to publish this.
Appendix
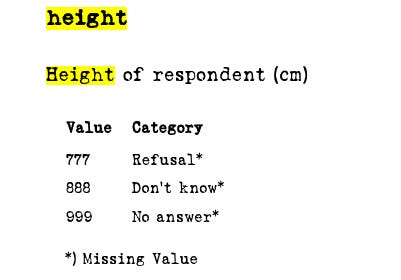
Variables used in the ESS:
GSS:
Extended analyses:
Excluding Hispanics: correlation is still r = .03 and not significant. The difference between Republicans and Democrats does seem to have marginally increased, to about .6 points of BMI.


The stereotype is accurate enough in that the areas of the country with Republicans are fatter, but it's not that accurate for individuals.
By the way, from the county study, "1% increase in county-level support for the Republican candidate corresponds to a 0.02% increase in age-adjusted obesity rates" (adjusted for their covariates). In other words, imagining two counties that are otherwise demographically identical, but one which is magically 100% Republican voting and one that is 100% Democrat voting, the difference would be 100 * 0.02%points, or 2%points. Basically zero.
If I had to guess, I would say New Jersey Republicans are probably the least fat conservatives (despite Chris Christie). Conservatism is associated with rural Christianity, whereas liberalism is associated with urbanism and education. Obesity is also negative correlated with intelligence.