TL;DR:
S Tier: Jensen and Kirkegaard (2024)
A Tier: Rindermann 2018, harmonized learning outcomes.
B Tier: Lynn’s estimates, Becker’s new dataset, Henns’ estimates, and the Basic Skills Dataset.
C Tier: World Bank test scores, Becker’s old dataset
D Tier: Human Capital Index.
Lynn 2002 (B tier)
A good effort, especially for its time. I disagree with Lynn’s use of geographic imputations, as people’s imaginations are good enough to fill in the blanks. It’s correct that using imputations can solve issues with restriction of range, and that it does not change regional averages, but it’s usually unnecessary and bad for PR.
A few countries (e.g. Italy, Argentina, Uruguay) are a bit high, otherwise it is one of the better national IQ datasets out there.
Lynn 2012 (B Tier)
The dataset did improve its coverage in terms of measured data (81 to 133), but I don’t think the figures themselves are much better. Past the use of raven’s tests and whatnot, the best increment in reliability happens after using the results from the regional scholastic assessments (e.g. PASEC), that were not adopted by the academic community until some years later.
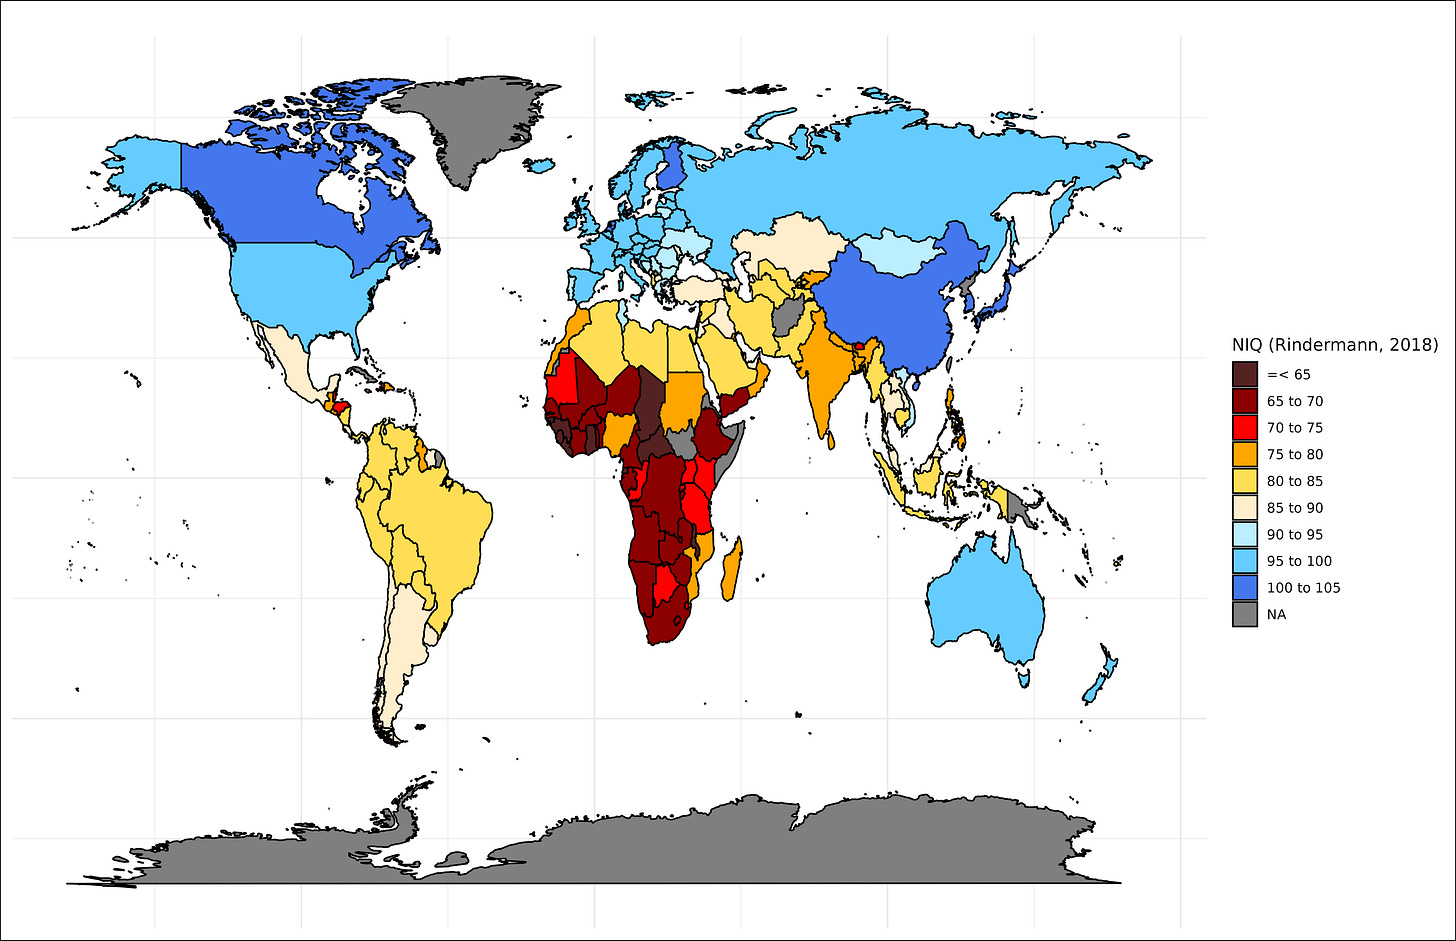
Rindermann 2018 (A Tier)
This dataset corrects for non-representative sampling within less developed regions, which improves the rank order accuracy of the estimates. It also uses data from the regional scholastic studies in Latin America and Africa that make the figures from those countries more reliable.
The rank order is also highly accurate — my only criticism in that regard is that Rindermann underestimates the cognitive ability of most East Asian countries with the exception of China.
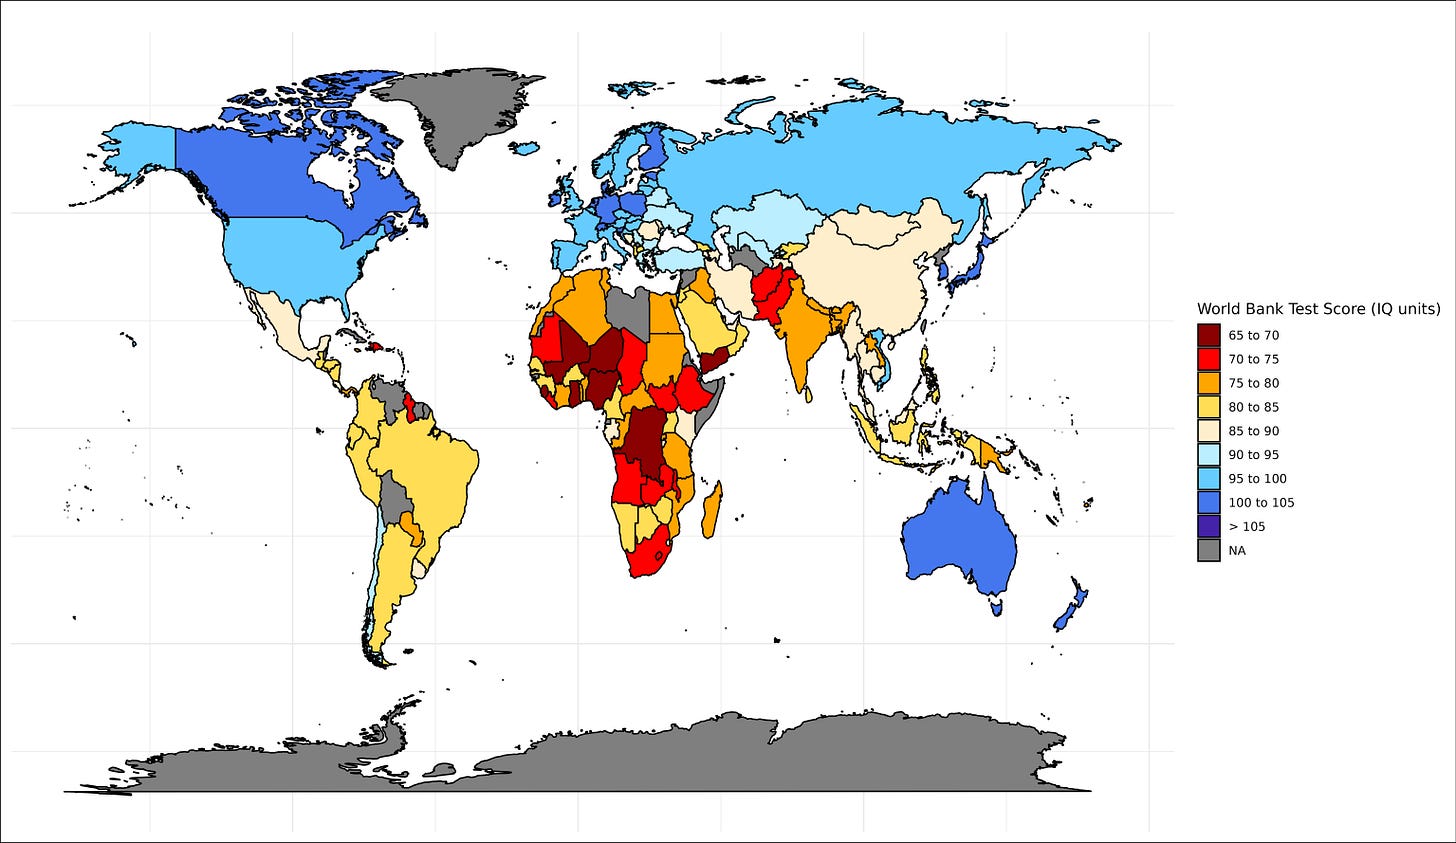
World Bank Test Scores (C Tier)
This dataset has multiple issues. They used an odd winsorization method, which artificially increases the differences at the lower end, and deflates them at the higher end. The rank order is also jagged, notably China is way too low; this is excusable for smaller countries where data is less available, but not larger ones.
Basic Skills Dataset (B Tier)
Superior to the world bank test scores in terms of rank order and methodology, but at the cost of covering less countries. The default version of the dataset also made imputations based on GDP per capita and a few other variables, which is a bad idea because it introduces systemic error into the means.
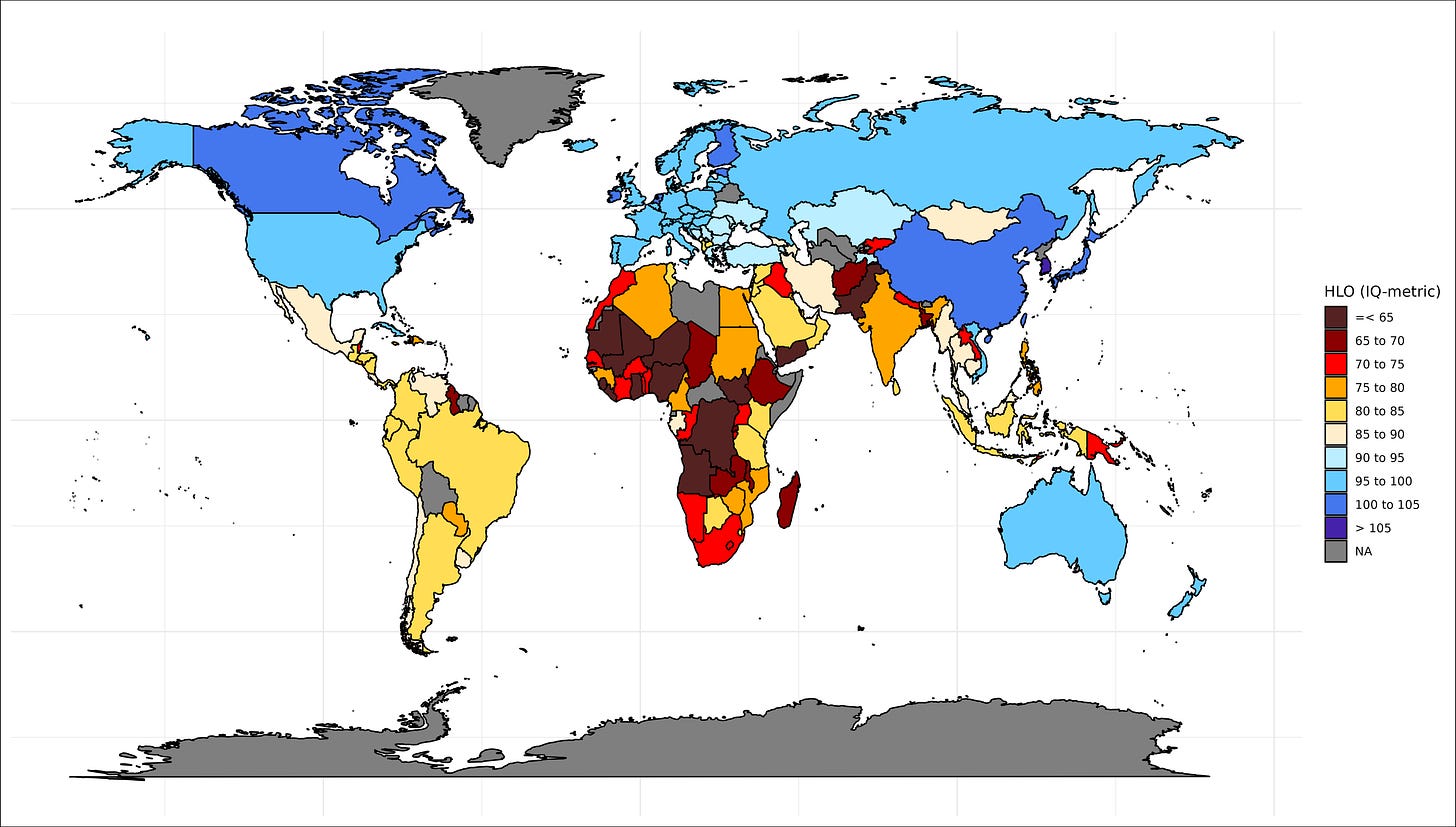
Harmonized learning outcomes (A Tier)
This dataset has both good methodology and a lot of coverage; the awkward rank order differences that are found in the World Bank test scores do not appear here. Some of the figures look a bit off (<70 for Bangladesh?) and the average for Western/Central Africa is too low, though to be fair there’s not much the creators can do about that issue besides winsorizing properly. Thankfully most of the large countries (e.g. China, India, Brazil) that other datasets occasionaly mangle are estimated accurately here.
Becker (old version) (C Tier)
I have a few complains about this dataset — the first one being that some of the figures here are implausible (e.g. 43 for Nepal), and that geographical imputations are used. The averages themselves are generally accurate, otherwise.
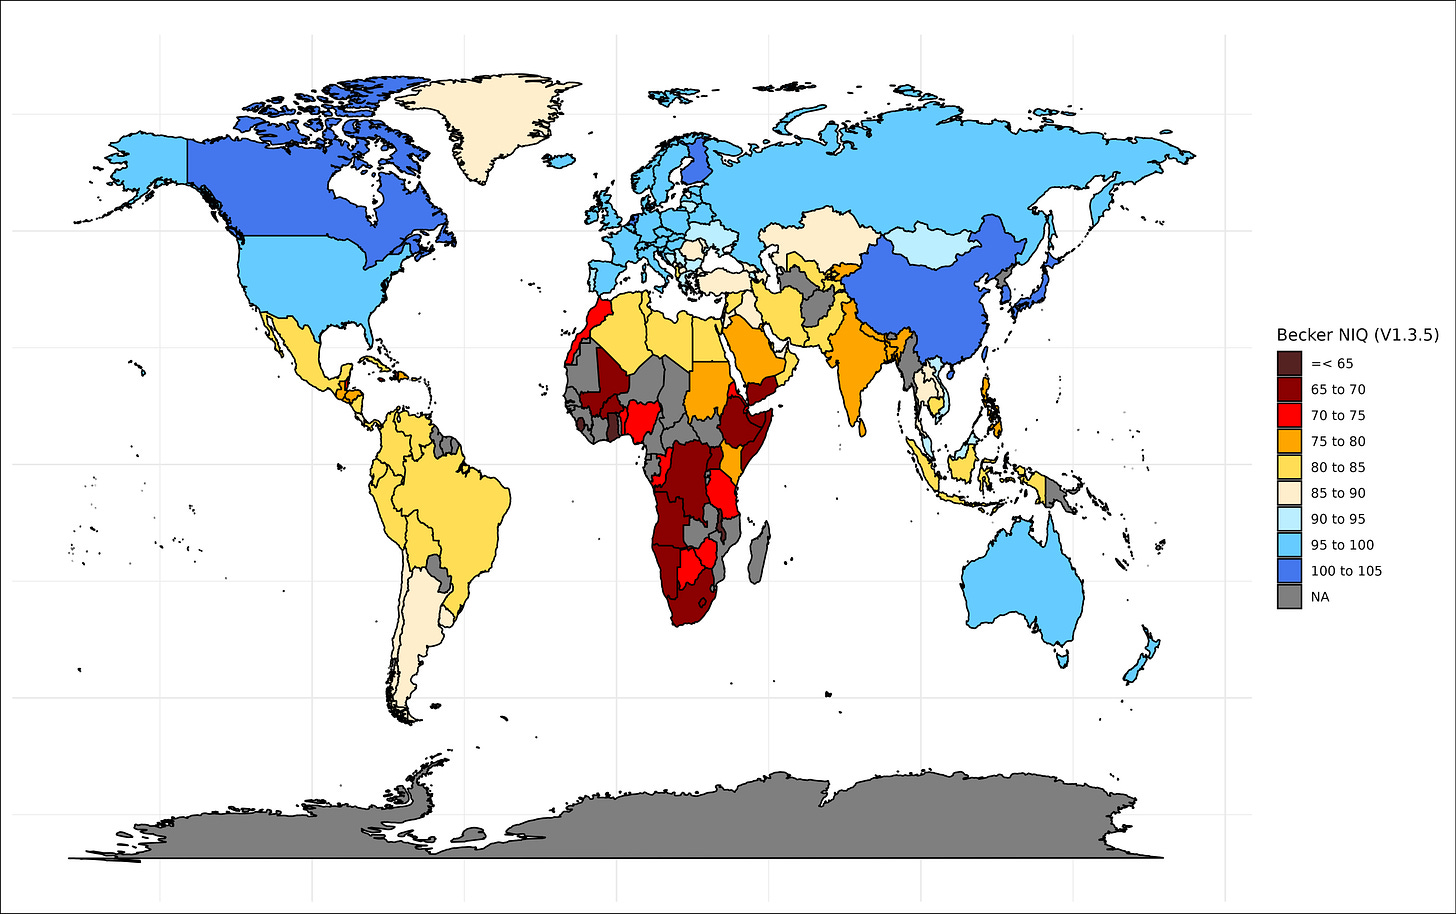
Becker (new version) (B Tier)
The rank order and magnitude of the differences estimated here are believable. It’s inferior to the harmonized learning outcomes and Rindermann estimates in terms of accuracy and coverage, but it’s a fine dataset in its own right.
This dataset is a composite of many previous attempts (the same thing I did), though Henss made a mistake by including the geographic imputations that other datasets created — this causes the averages at the lower ends to be artificially similar, though it does make the figures more stable.
A low ranking for a dataset with this level of coverage, which was given for several reasons.
First, the measurements are not standardized, so the significance of Sub-Saharan Africa having an HCI of 0.4 and Japan having an HCI of 0.8 is not clear.
There is also the issue of using health and education measures to estimate human capital: yes, on average, more competent populations will be healthier and have higher levels of education, but this causes the metric to be contaminated with national development.
Jensen and Kirkegaard (S Tier)
The vanity of placing your dataset first aside, these estimates have multiple objective edges over the others: it relies on averages of other estimates, which makes the errors other researchers make average out. It also improves the coverage, as some researchers will neglect to use some sources of data that others will.




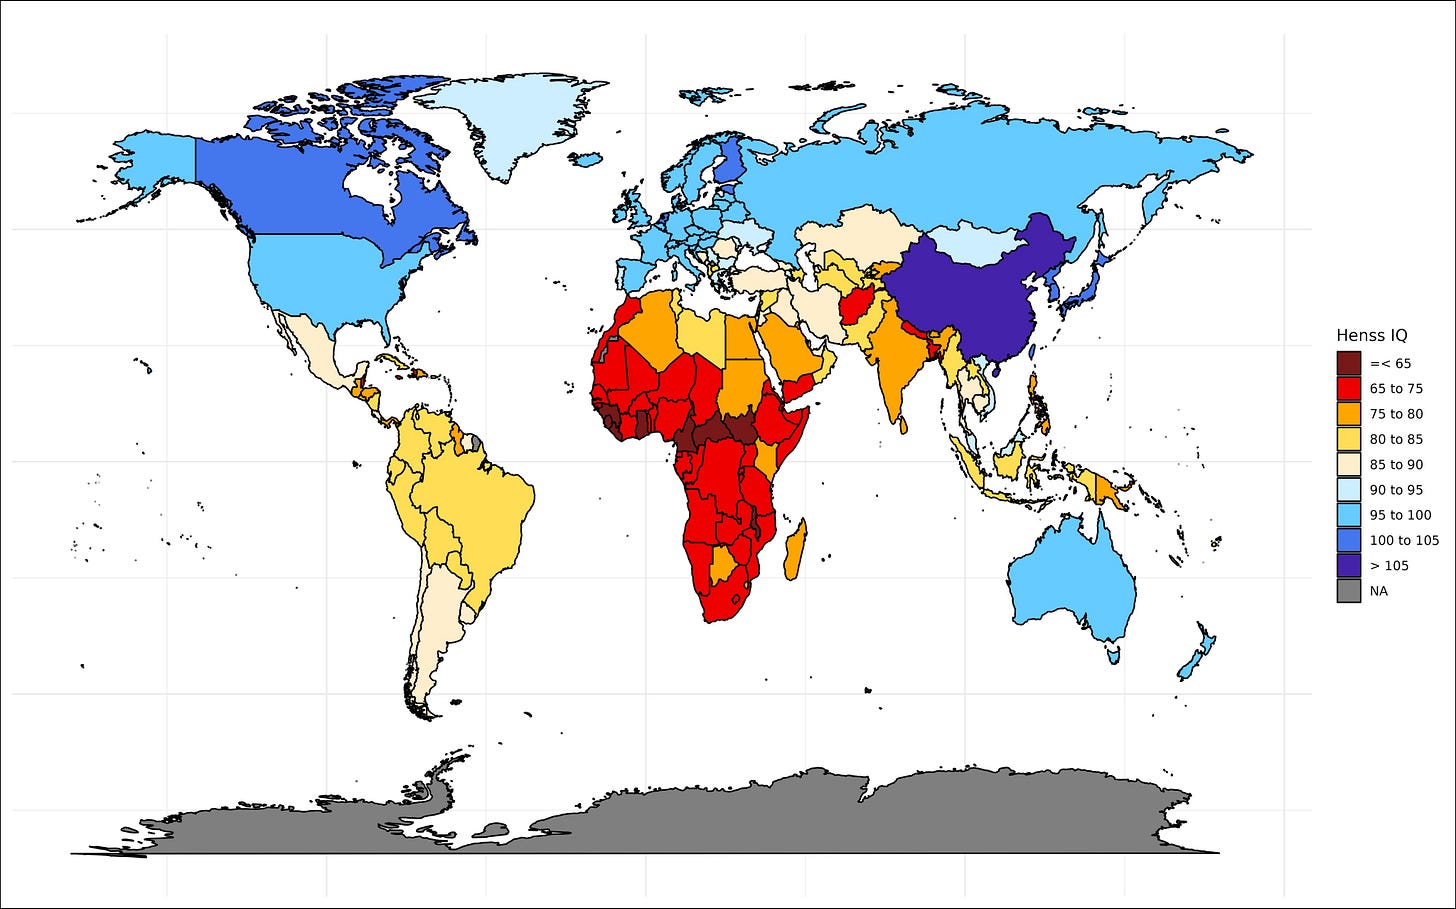

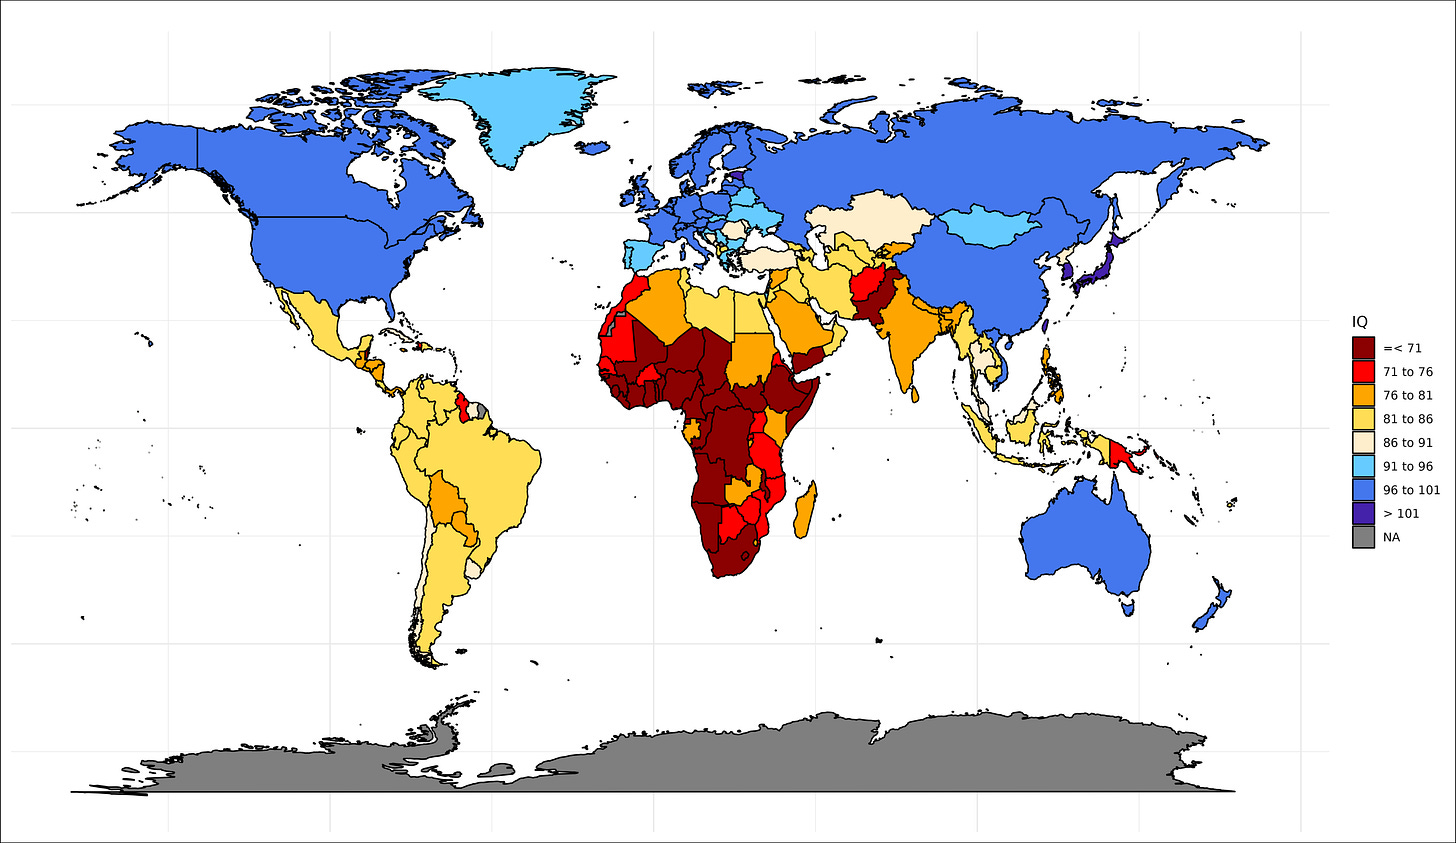
I've seen a lot of these throughout the years and never gave much thought to the odd variations between them, and am glad to see the S tier approach. Here are the surprises to me:
1. Morocco. I typically think of it as one of the most stable countries in Africa and the broader Muslim world.
2. Ethiopia. Ethiopia has an extensive history of empires and resisting colonization, so I am surprised to see it below both Kenya and Sudan. I suppose there is a civil war going on?
3. The west-east axis in Africa. This is either an artifact of the Bantu expansion, or possibly the difference between British colonization and non-British colonization. I'm betting that Somalia will be the biggest beneficiary of potential political stabilization.
4. Pakistan. What the hell is going on in Pakistan? I understand there is cousin marriage, but relative to Afghanistan? To Saudi Arabia? This is very surprising.
What's the difference between the C tier World Bank Test scores and the A tier Harmonized Learning Outcomes hosted by the World Bank? Back in 2022, I wrote about the World Bank's Harmonized Learning Outcomes database:
https://www.takimag.com/article/a-little-learning/
But I can't tell from this which one I used. (I noted that the Chinese score of 441 seemed implausibly over-corrected for lack of representation in inland provinces.)