
Adjusting ratings for user bias
case study of anime

There are many websites that rank media based on ratings that users give such as imdb or myanimelist. Typically, they avoid biases like the winner’s curse from skewing the ratings by excluding entires with less than ~10,000 ratings from the list or weighing scores by popularity.
Alternatively, scores could be biased because some users give systematically lower or higher scores, and that scoring tendency could correlate with tastes for items. If this is the case, ratings for things that tend to be rated by people who give high ratings will be biased upwards.
To test whether this bias matters, I searched for datasets that included ratings of objects by people, and came across a dataset of 1,123,284 myanimelist users who ranked 13,379 anime.
To correct for the user bias, I first tried using linear regression with fixed effects for users and anime, but my computer didn’t have enough RAM to perform it, so I decided on a different method1. First, I calculated the average rating for each anime and user. Then, I calculated the averages for anime controlled for the average rating users gave, and then measured the averages for users relative to the anime they watched. The code for the first iteration looks like this:
test2 <- test
test2$ascore2 <- test2$score
test2$uscore2 <- test2$score
test2$score2 <- test2$score

###Original ratings
uranks <- test2 %>% group_by(user_id) %>% summarise(userscore=mean(uscore2, na.rm=T), un=n()) %>% arrange(-userscore)
aranks <- test2 %>% group_by(anime_id) %>% summarise(animescore=mean(ascore2, na.rm=T), an=n()) %>% arrange(-animescore)

###Joining original ratings to new dataset
test2 <- left_join(test2, uranks %>% select(user_id, userscore, un), by='user_id')
test2 <- left_join(test2, aranks %>% select(anime_id, animescore, an), by='anime_id')

###Calculating the diff between ratings and average score for the anime/users
test2$adiff <- test2$score2-test2$userscore
test2$udiff <- test2$score2-test2$animescore

test2$ascore2 <- test2$adiff+mean(aranks$animescore, na.rm=T)
test2$uscore2 <- test2$udiff+mean(uranks$userscore, na.rm=T)

###Averages controlled for user/anime-specific effects
aranks2 <- test2 %>% group_by(anime_id) %>% summarise(animescore=mean(ascore2, na.rm=T), an=n()) %>% arrange(-animescore)
uranks2 <- test2 %>% group_by(user_id) %>% summarise(userscore=mean(uscore2, na.rm=T), un=n())
This process was repeated 9 more times. After the 4th iteratation, additional iterations didn’t make a difference2. I also forced the user-adjusted anime ratings to conform to the distribution that the original ratings conformed to. I then excluded anime with less than 5,000 ratings from the total ranks to avoid winner’s curse. These are the top 20 for the unadjusted and adjusted (after 10 iterations) ratings:
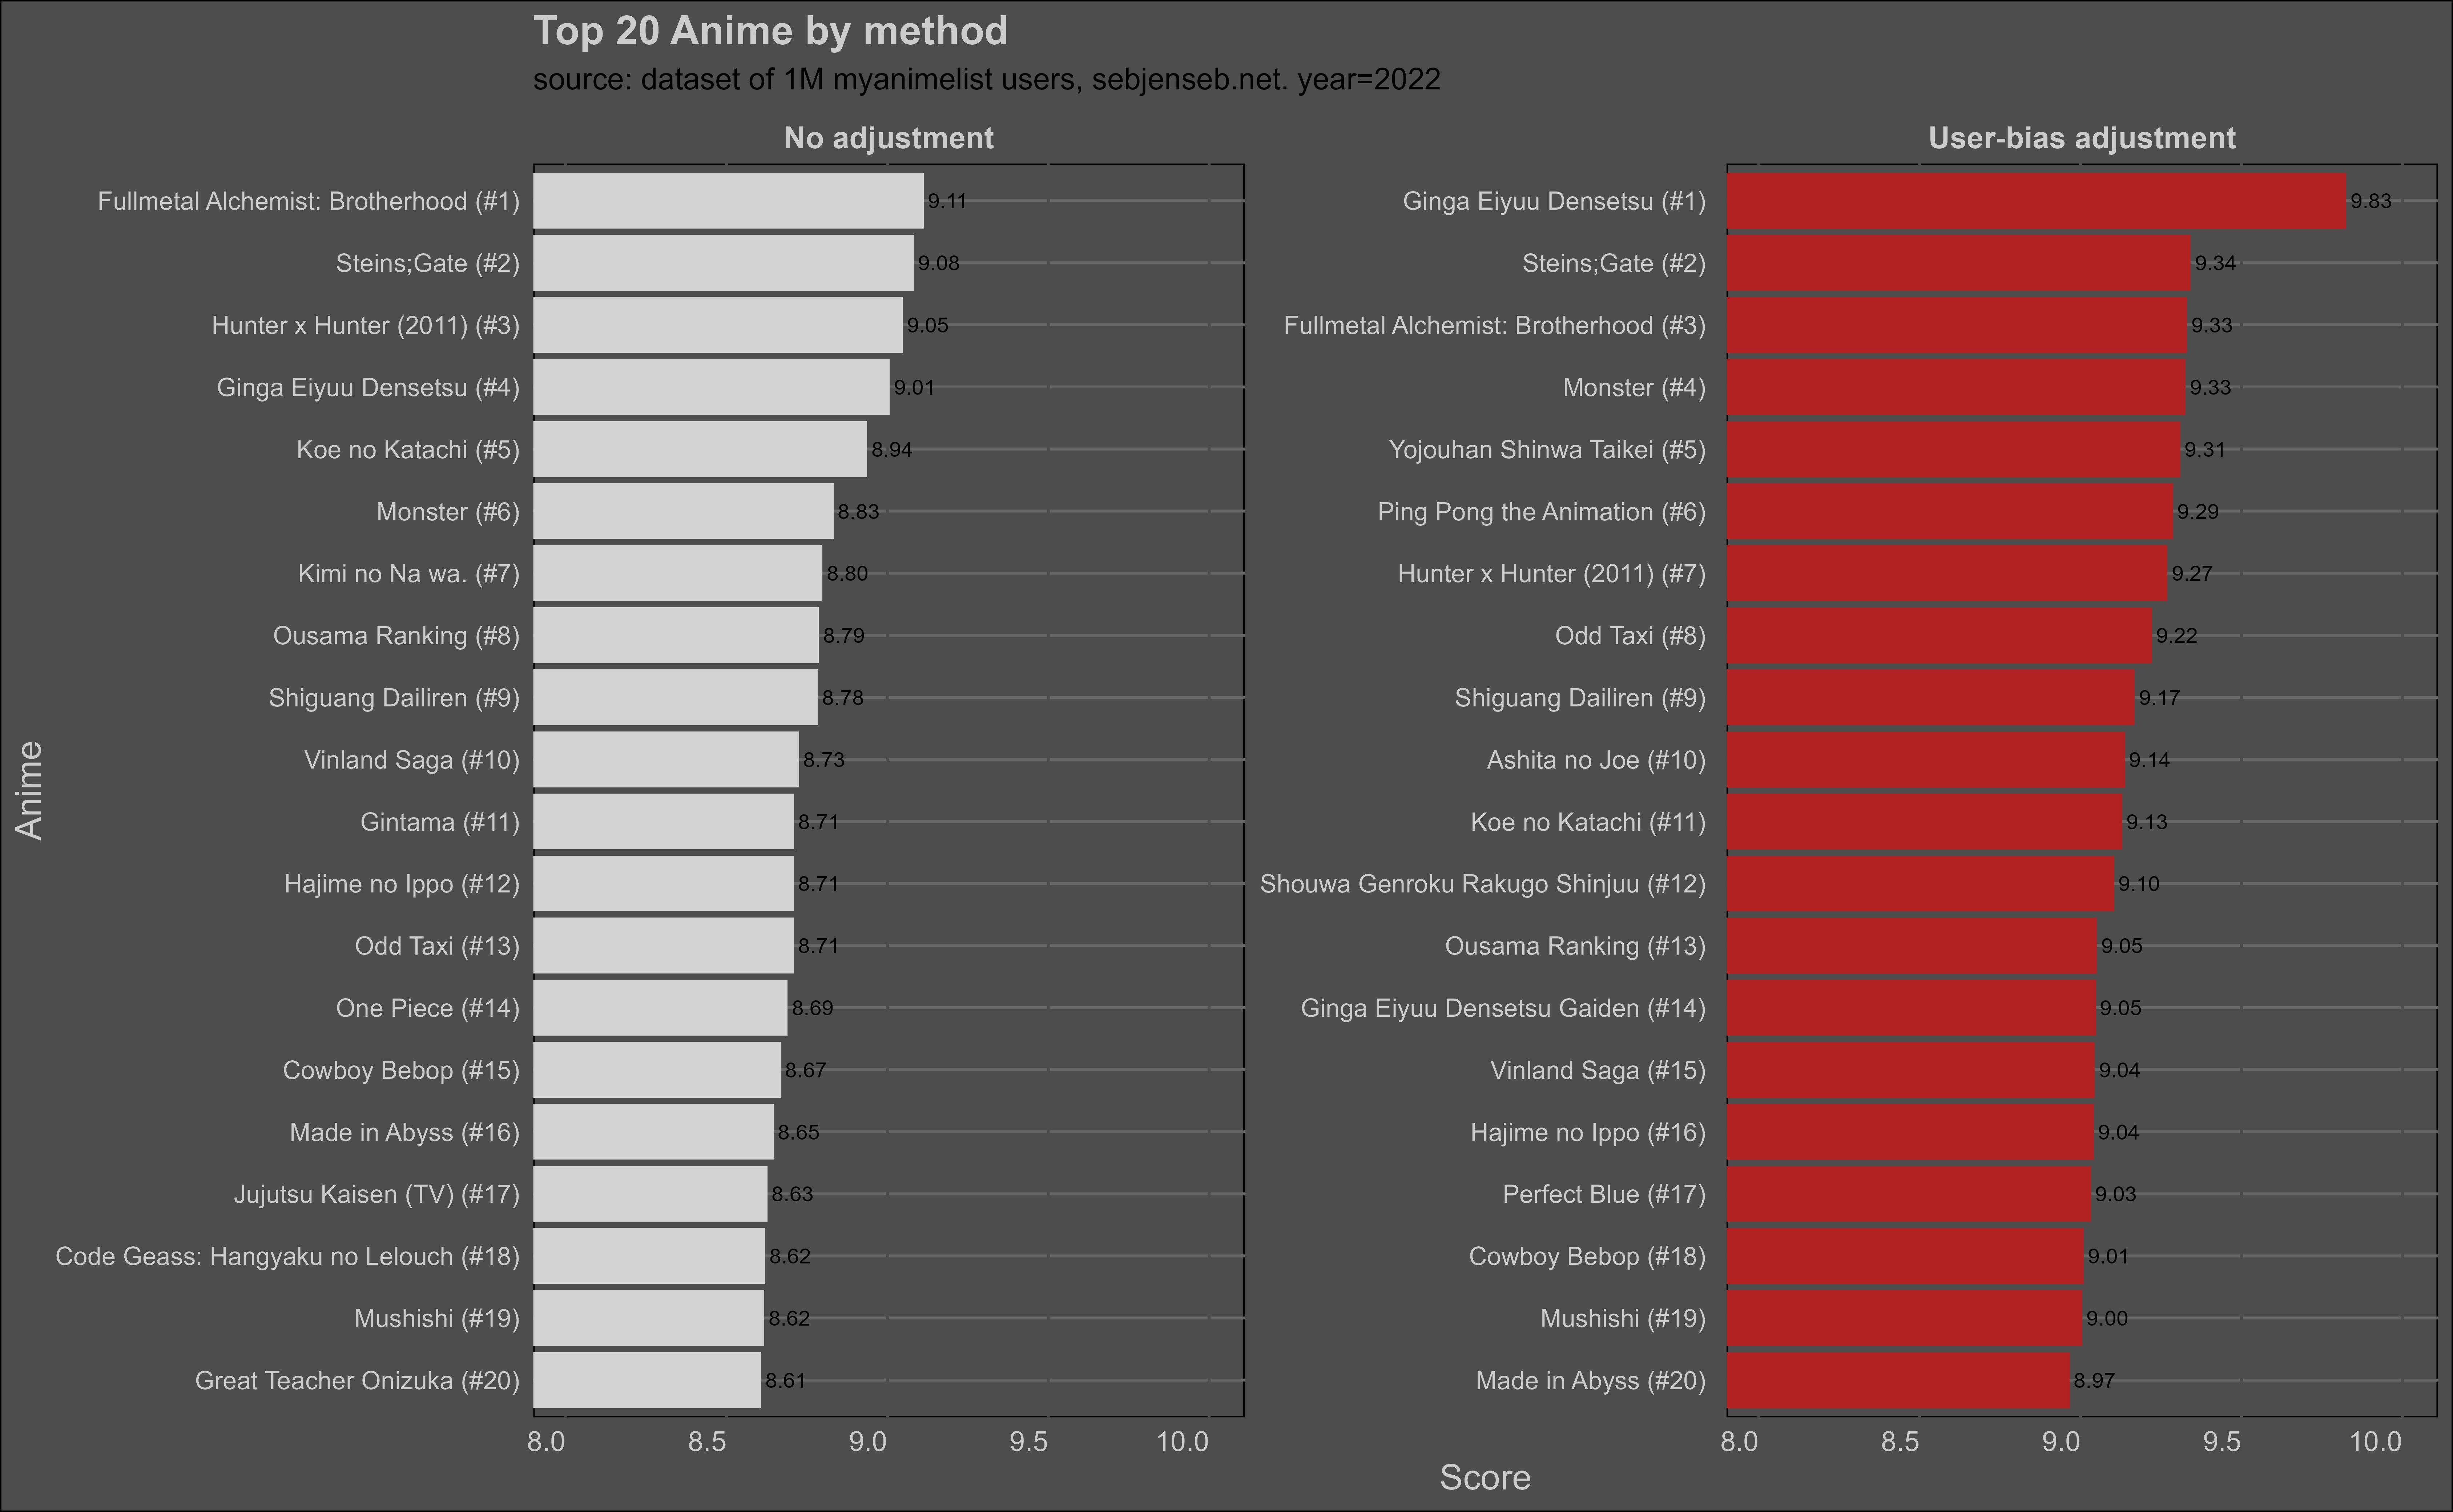
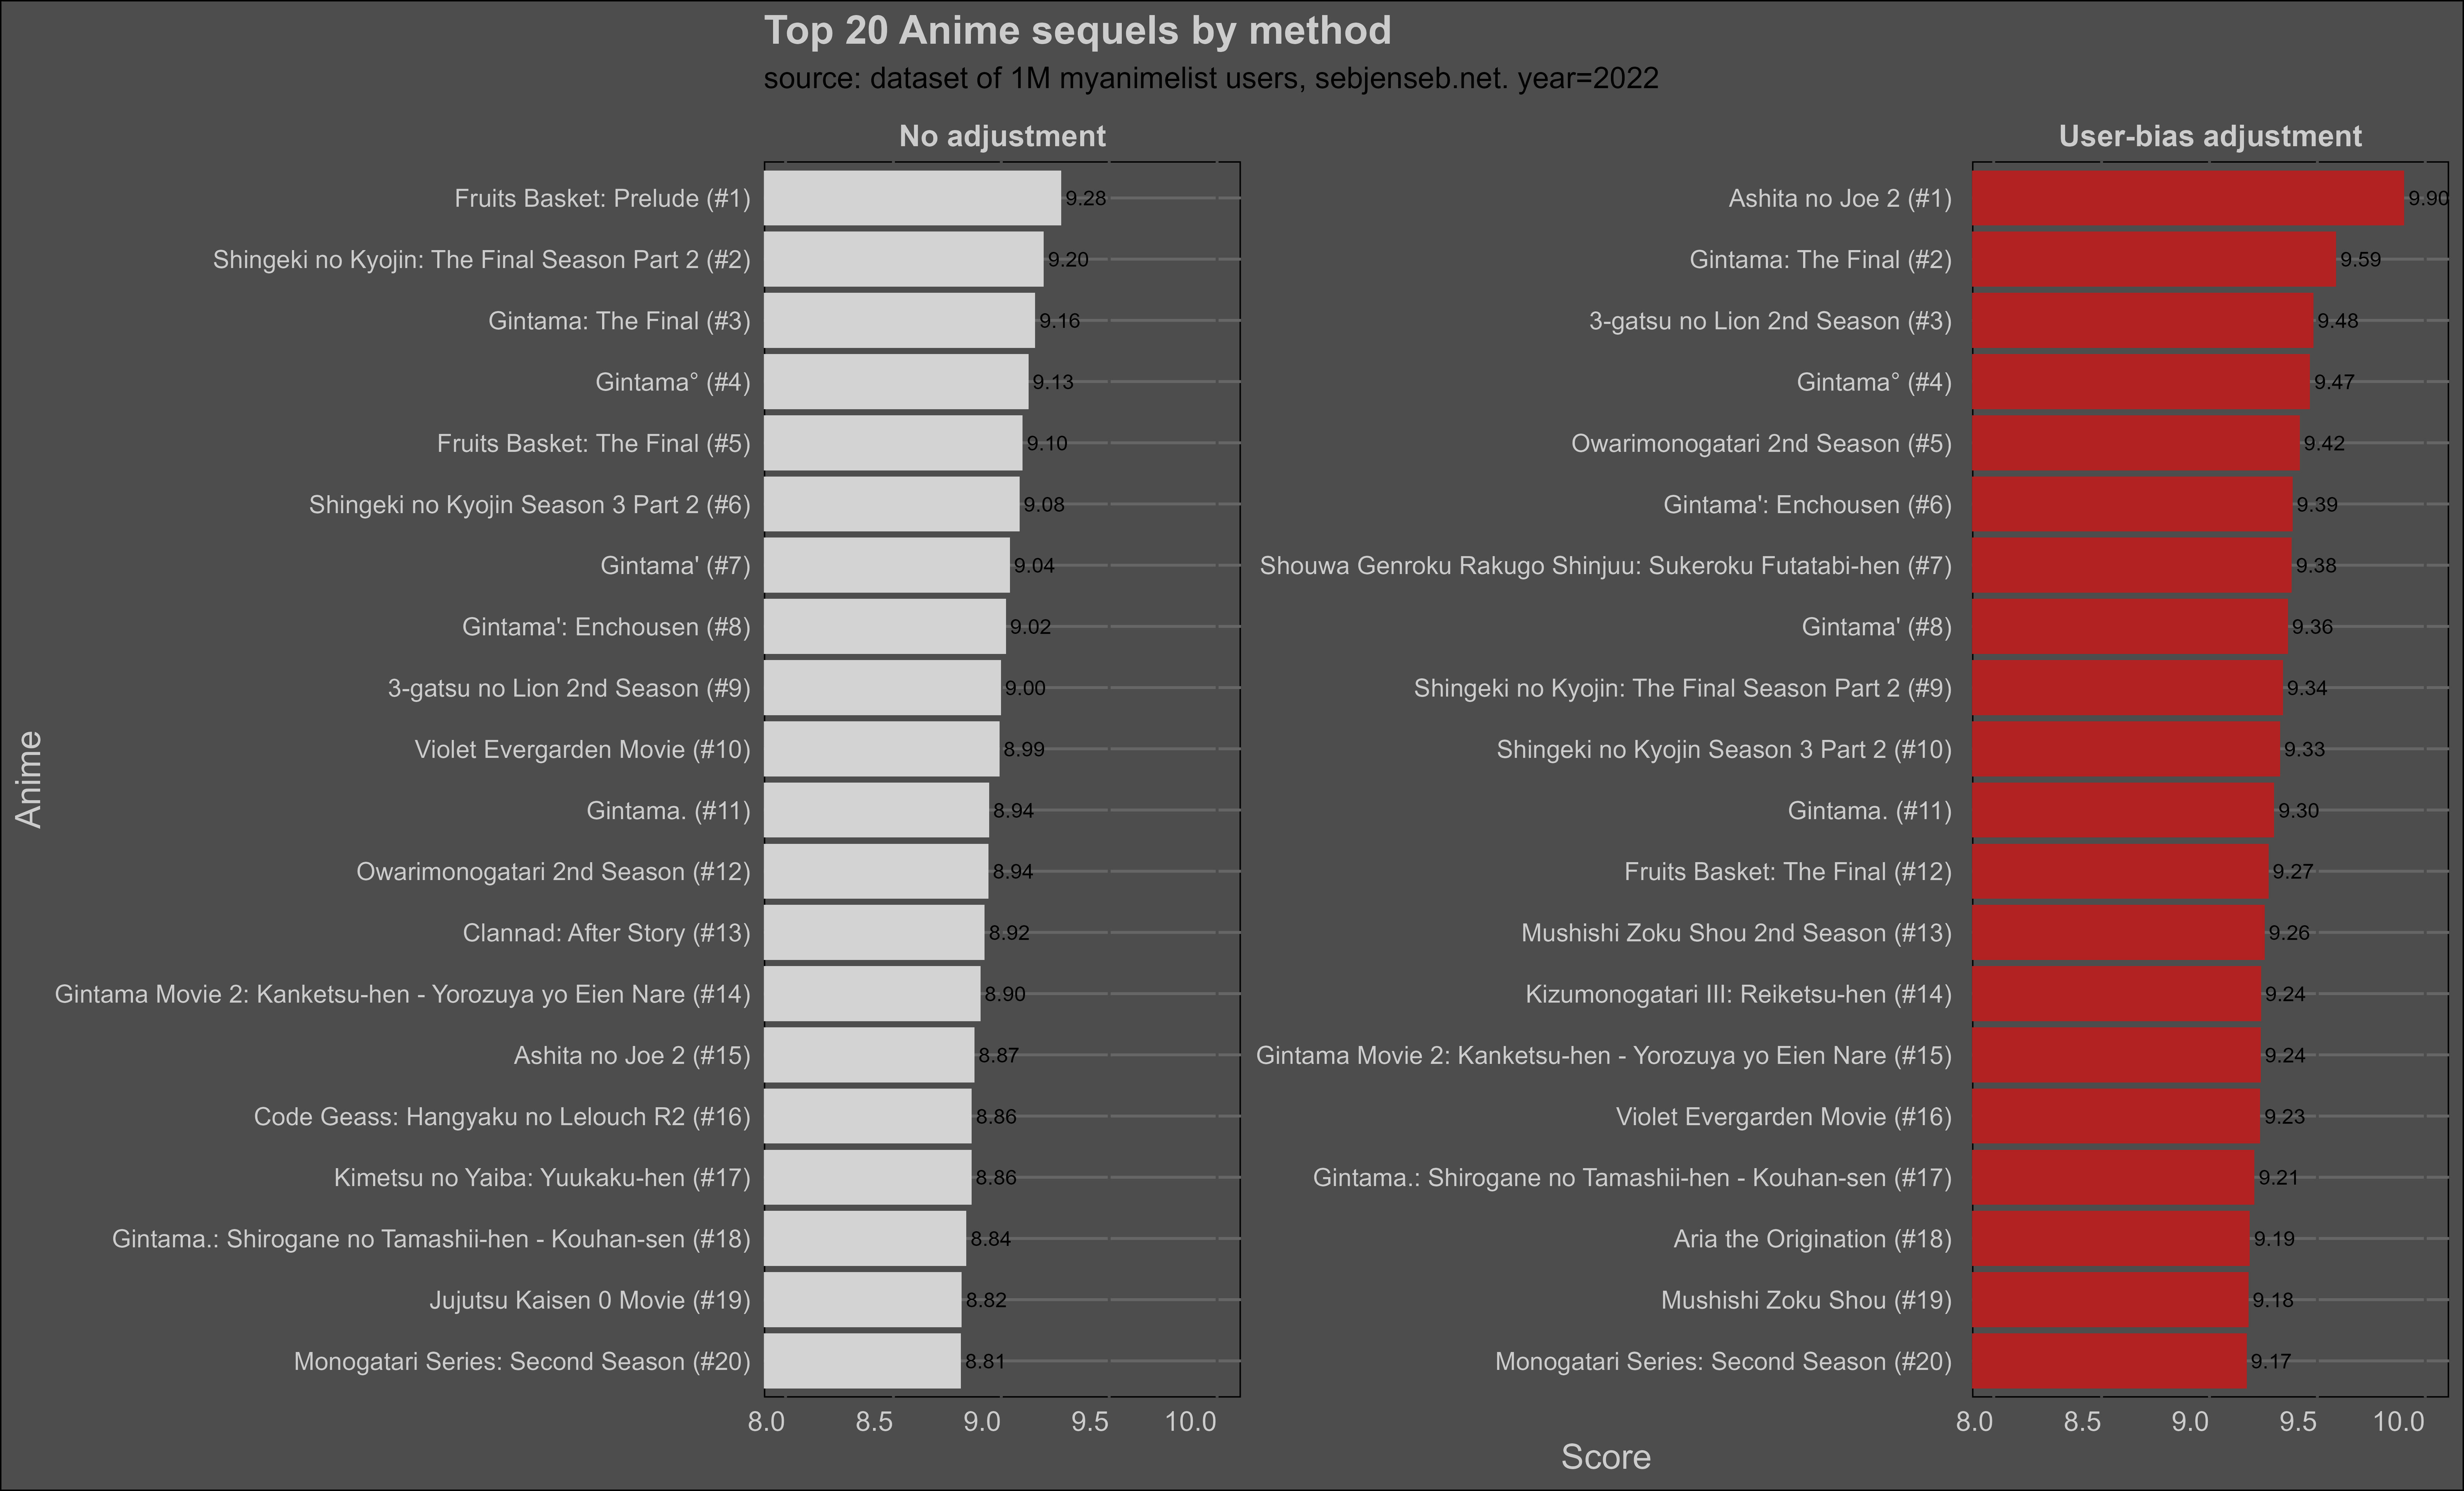
All of Masaki Yuaasa’s works increased substantially in rank when adjusted for the user-bias — Ping Pong the Animation and Tatami Galaxy entered the top 20, and Kaiba was one of the anime with the largest difference between original (8) and bias-adjusted rating (8.9). Both seasons of Ashita no Joe jumped an entire score, and both versions of Legend of the Galactic Heroes jumped massively in rank, the original version taking first spot on the list. Traditionally “elitist” anime seem to benefit the most from the bias adjustment.
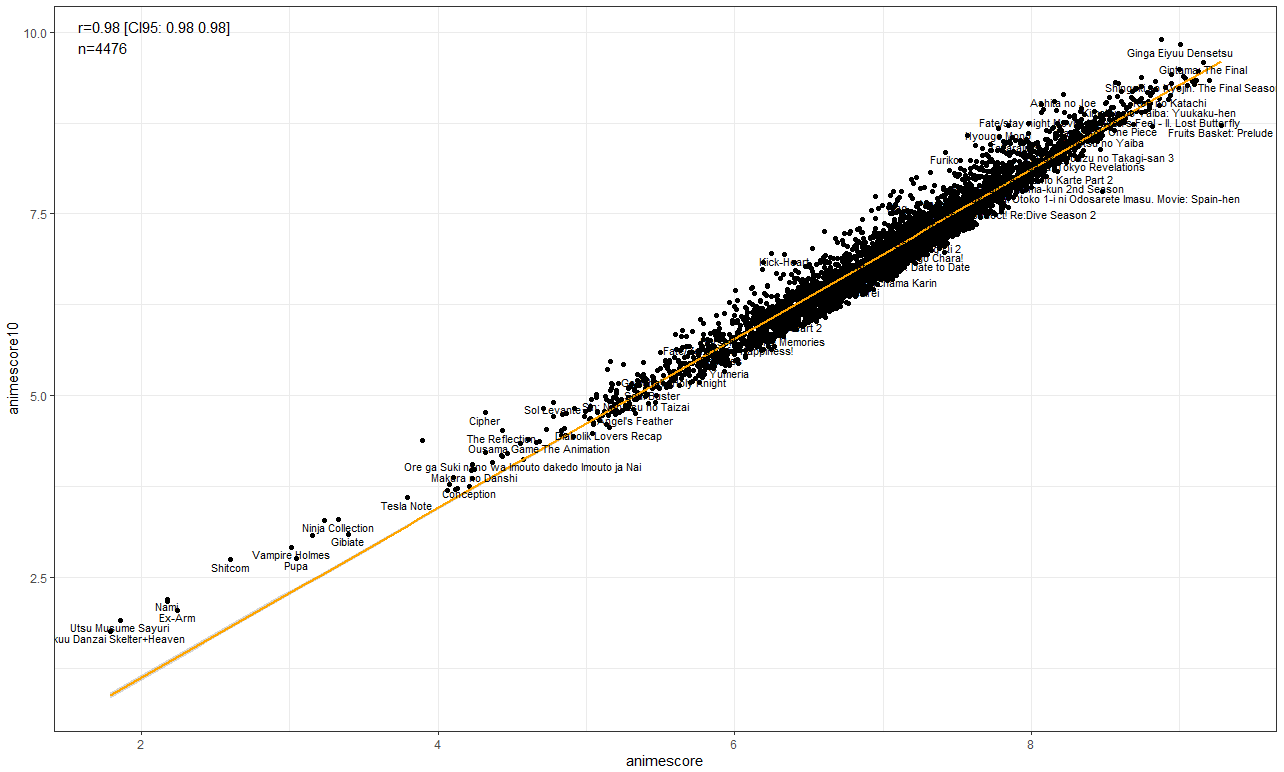
The original ratings correlated at .98 with the user-bias adjusted ratings:
Despite the high correlation, the top 20 for the user-bias adjusted ratings was not the same — Tatami Galaxy jumped from rank 86 to rank 16 and Fruits Basket: the Prelude fell from rank 1 to rank 137. Most anime have roughly the same rank, but there are a many which fell up and down a thousand ranks:
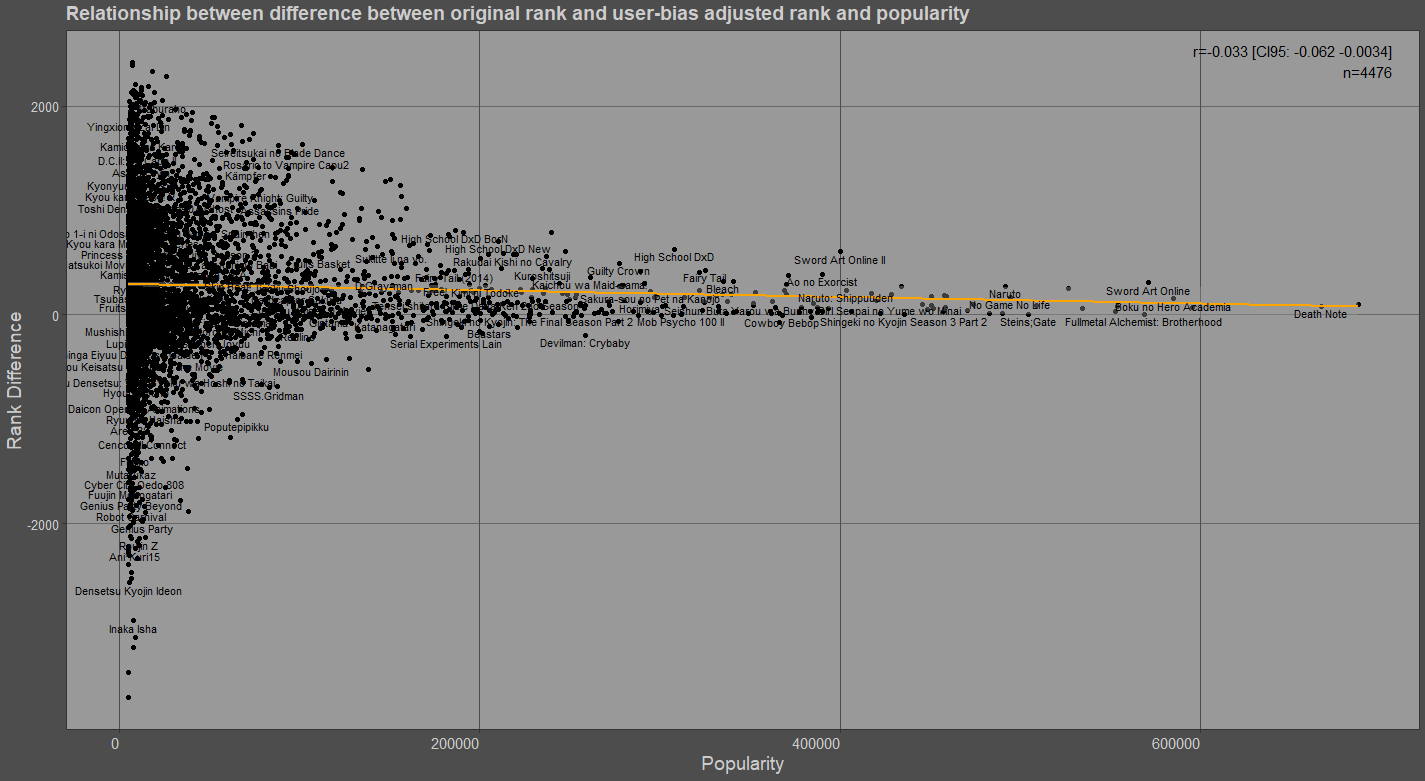
It appears that the difference metric may be biased by error (note that less popular anime have larger rank differences), but I suspect this bias is not as large as it presents itself to be: anime that are less popular could have larger selection effects in terms of the difference between the viewers and non-viewers.
If you saw somebody doing this exactly a year ago, it was me on a different ID.
Correlation matrix of original anime ratings, first iteration, fifth iteration, and tenth iteration:
I ranked anime using matrix factorization, and my results closely match yours. Matrix factorization accounts for users giving systematically higher/lower scores through user biases and for scoring tendencies being correlated with taste through user/item factor scores. Here’s the top 10:
1) Fullmetal Alchemist: Brotherhood
2) Legend of the Galactic Heroes
3) Steins;Gate
4) Gintama
5) Clannad: After Story
6) Code Geass: Lelouch of the Rebellion R2
7) Your Name.
8) A Silent Voice
9) Monster
10) Mushi-Shi