

Main takeaways:
Ideal intake for a given nutrient for preventing mortality is usually higher than the US RDA.
Risk of vitamin D overdose is massively overblown, and the main side effect (calcification of arteries) is easy to mitigate by supplementing K2 MK7.
Risk of ingesting saturated fat and cholesterol are overblown.
Sodium is a necessary mineral and the risk of taking too much of it is overblown.
No strong opinion on the debate on PUFAs, but I recommend restricting intake as a conservative measure.
Although most conventional health advice from authorities is accurate, all institutions falter, and it is important to know when they do. Notably there has been a lot of pushback online against the salt, cholesterol, and saturated fat guidelines that are set by most health authorities, and I later find evidence to support this backlash.
Most of the estimates here come from taking studies that assess self-reported food intake and correlate it with all-cause mortality. Usually these studies control for the typical confounders (e.g. race, age, sex, education, smoking BMI, hypertension), though regardless there is the problem that correlation =/= causation, where people who engage in one behaviour that is considered healthy are more likely to engage in other behaviours that are considered healthy. Controlling for intake of a nutrient that highly correlates with intake of another is also inappropriate; imagine estimating the effect of ingesting saturated fat when controlling for cholesterol intake. That is not estimating the effect of eating foods with saturated fats, it’s estimating the effect of eating foods that are high in saturated fat but low in cholesterol.
That aside, this would not be an issue if said considered-to-be healthy practices were not more likely to succeed than fail. Even in cases where the mainstream health advice is clearly wrong, the confounding problem does not bias the cross-sectional association between intake and mortality, besides in perhaps saturated fat.
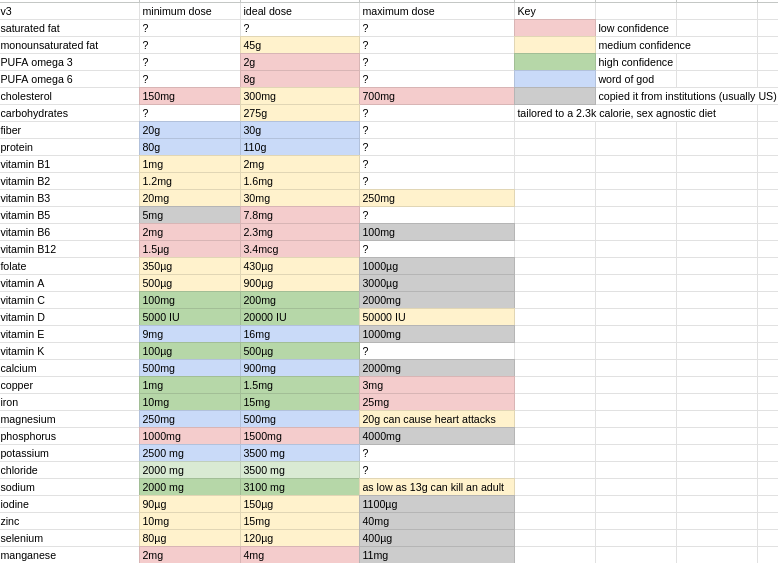
The notation ‘minimum dose’ and ‘ideal dose’ are used to describe two different points: the minimum dose is too low, but not so low as to be a practically significant health hazard, and the ideal dose is the dose that is most reliably associated with lower mortality or better outcomes in general.

In the example of salt, I set the minimum and ideal doses to 2000mg and 3100mg respectively:

Given that these charts are typically sex-invariant, I made it so the recommendations are too; as a rule of thumb, a man should take about 10% more of the RDA, while women would suffice with 10% less. It also goes without saying that the optimal intake for a given nutrient will depend on the person; salt sensitive people (like myself) are better off with less salt, those who are not are better off with more.
In some cases, when there does not seem to be a flattening curve (as in this image) I set it to the highest dose at which there are not wonky confidence intervals (in the case of salt, it would be 4000mg). In some cases, there is little data available, and guesswork (e.g. historical mean intake, extrapolating based on other data) had to be used.
At the end of the article is a list of many studies and notes that informed my reasoning.
Here is a summary of my thought process on each specific recommendation:
Monounsaturated fat
Most people seem to agree this is the healthiest type of fat, and cross-sectionally it is reliably related to lower levels of mortality. The only concern online I’ve seen about it is that it is fattening, so unless you are desperate to find a way to lose weight, I would recommend eating a large amount of it.
Polyunsaturated fat
I have mixed opinions on it. On one hand, mechanistically intake should be linked to higher levels of atherosclerosis and lower metabolic rate; animal studies generally show the same thing. The rest of the evidence, however, is not as consistent: replacing SFAs with PUFAs has no effect on all cause mortality (in fact, it favours PUFAs to a small degree) and the cross-national evidence does not suggest it plays a large role in obesity. Overall, I would recommend limiting intake to about 10 grams per day with an omega_3/omega_6 ratio of 1:4, roughly the norm for humans historically.
It’s a bad idea to fry anything in seed oils (or use them in general), especially if the oil is reheated repeatedly due to the fact that the oil eventually breaks down and becomes rancid.
A nice study on this phenomenon examined the effect of heating on the chemical makeup of three different oils: coconut oil (largely saturated fat), soybean oil (a seed oil), and sunflower oil (another seed oil). First they isolated a batch of oil which was heated for 10 minutes and then was used to fry cut potatoes for 15 minutes. Some of this oil was isolated and named ‘singly heated oil’ and another batch of it was used to fry batches of potatoes on three separate occasions, which was named ‘repeatedly heated oil. Teheated soybean and sunflower oil contained higher levels ‘polar compounds’, which this study described as a total of “triacylglycerols, free fatty acids, hydroperoxide, carbonyl compounds, and others formed due to the thermal hydrolysis and oxidation of oil when used in deep-frying food”.
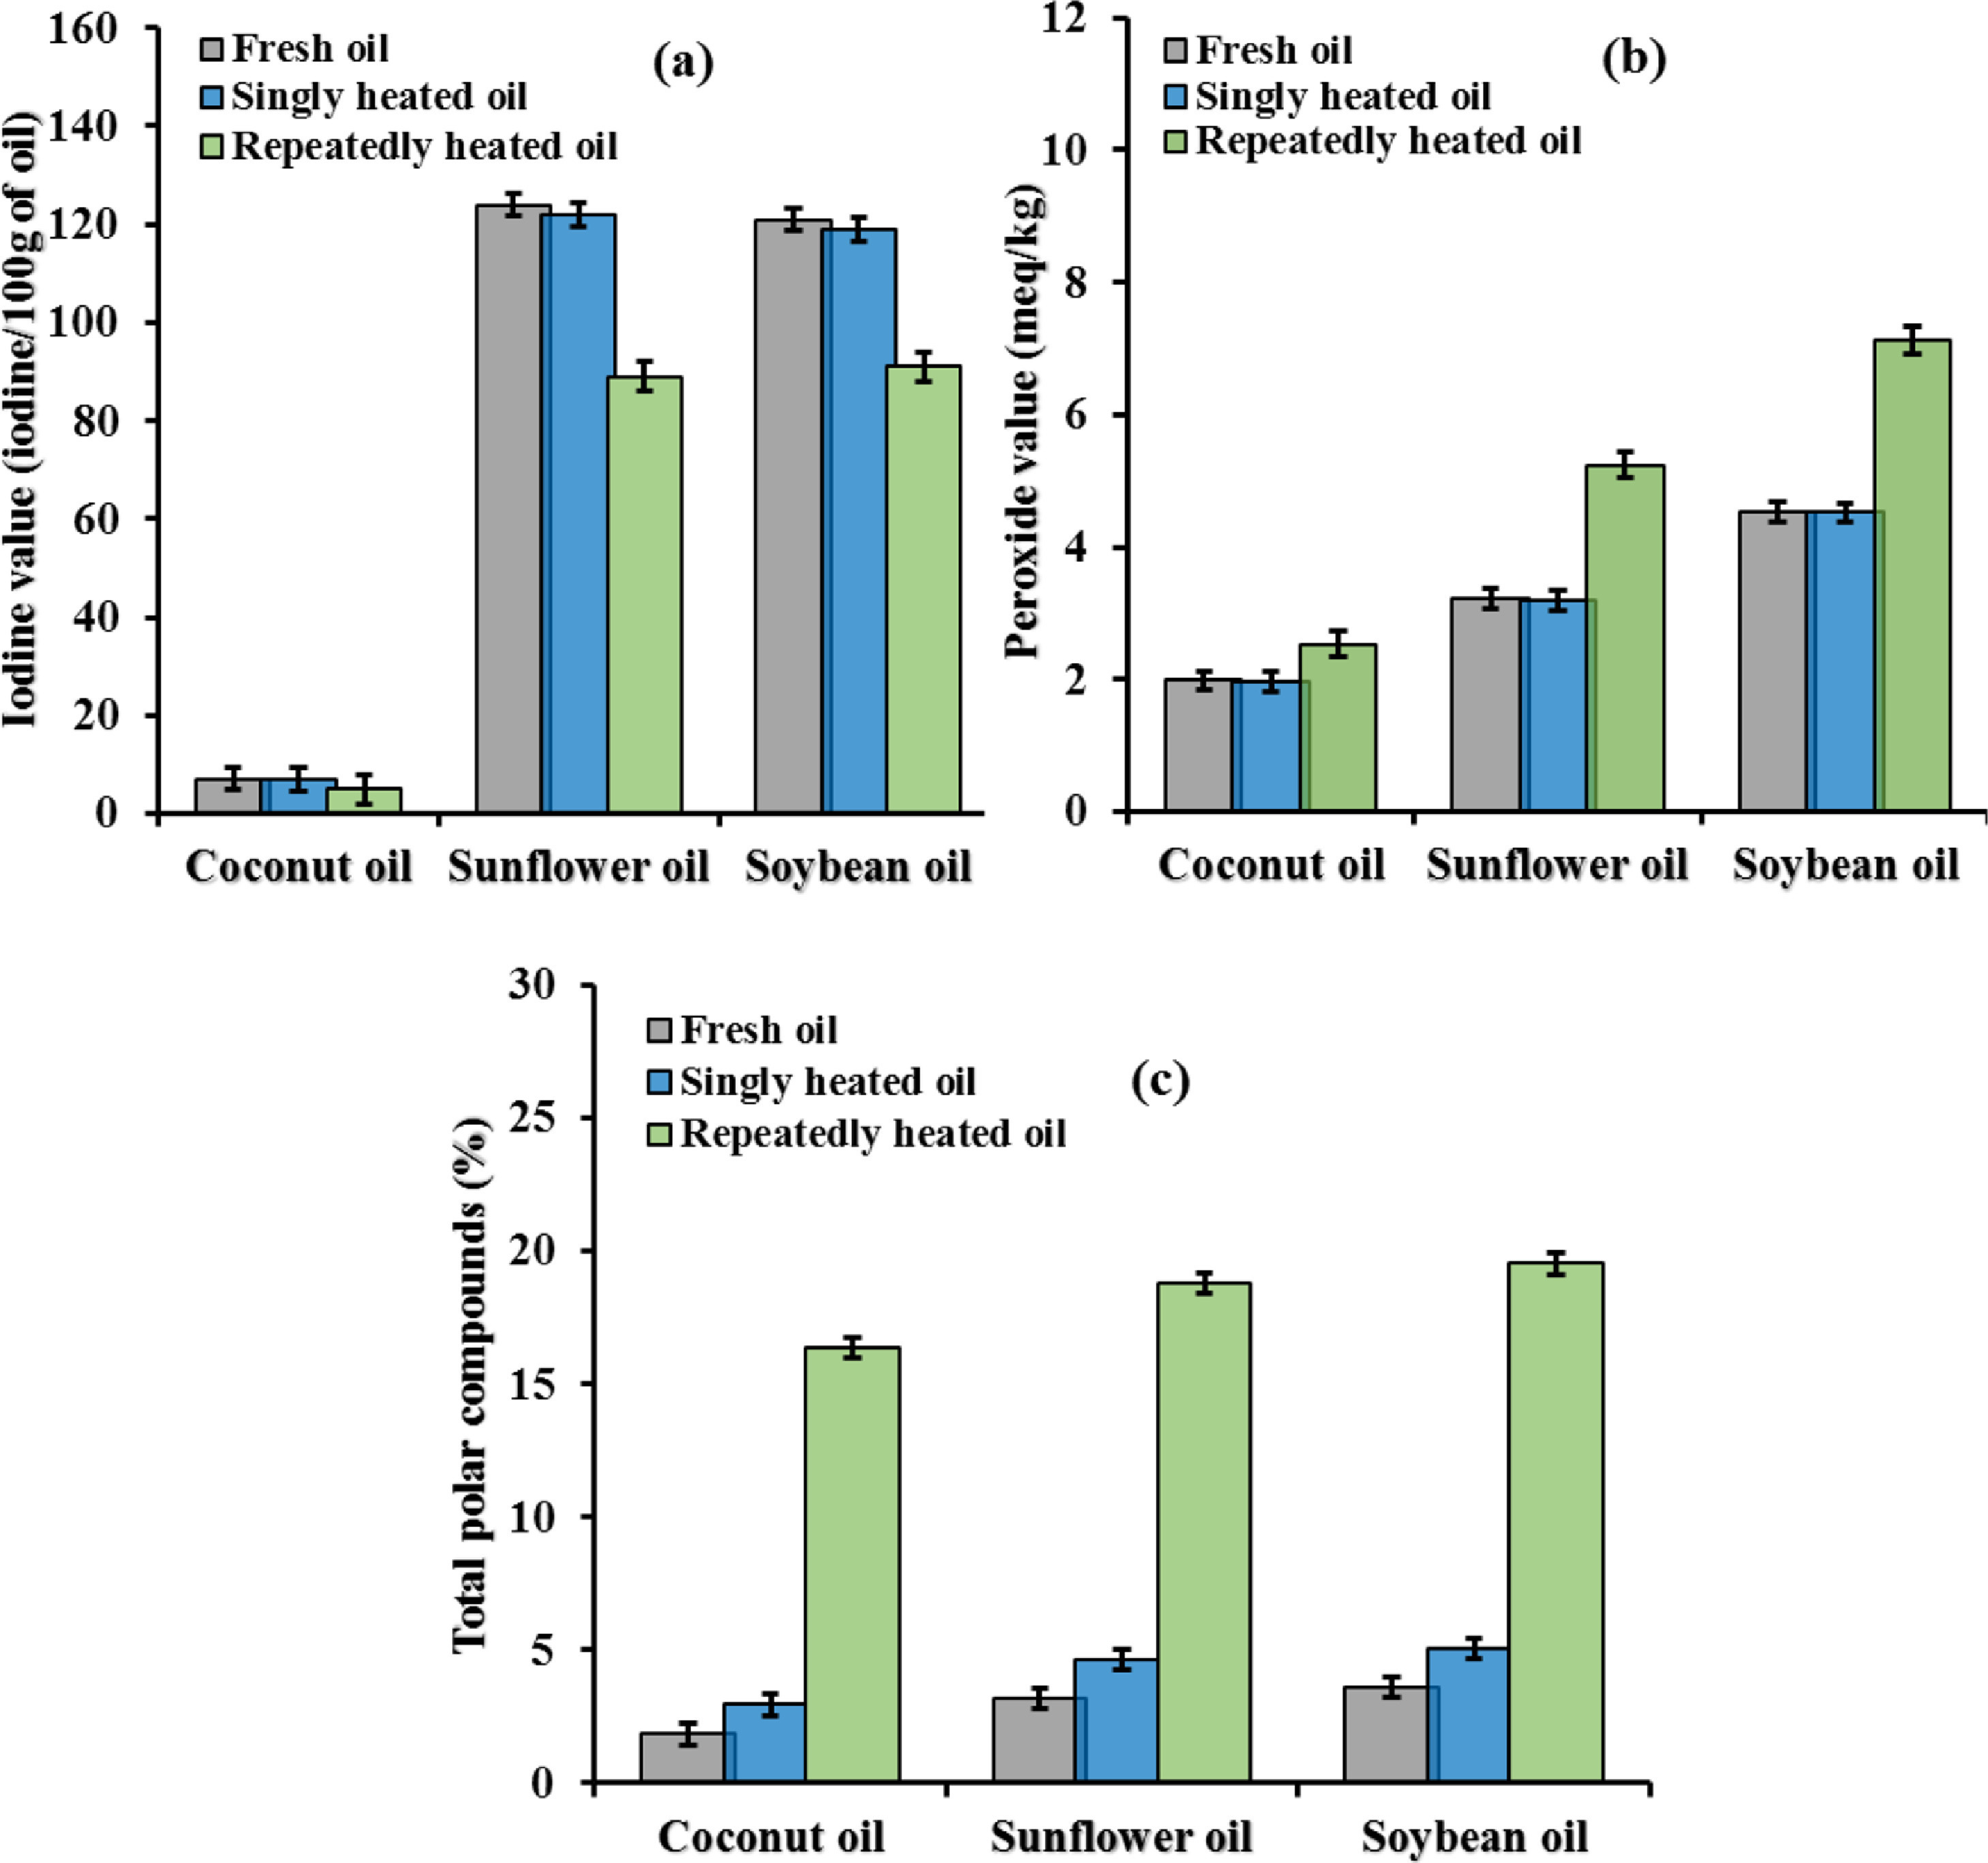
The particularly harmful products of this reheating process are the hydroperoxides, which can cause oxidative damage, and the carbonyl compunds such as aldehydes, which are considered to cause cancer. Although the study I cited did not mention this, reheating seed oils also causes an increase in trans fats, which are generally agreed to be bad, though I can’t say I know if they are for sure.
The mainstream health community and the alt-health community agree on this issue, and there are multiple scientific papers (one, two, three) that agree that reheating oils, particularly seed oils, is bad for health.
For this reason, commercial chips fried in seed oils and fried food in restaruants should be eaten sparingly, if at all, unless there is reason to believe that the restaurant does not reheat oil.
Saturated fat
I don’t recommend ingesting any particular amount of saturated fat.
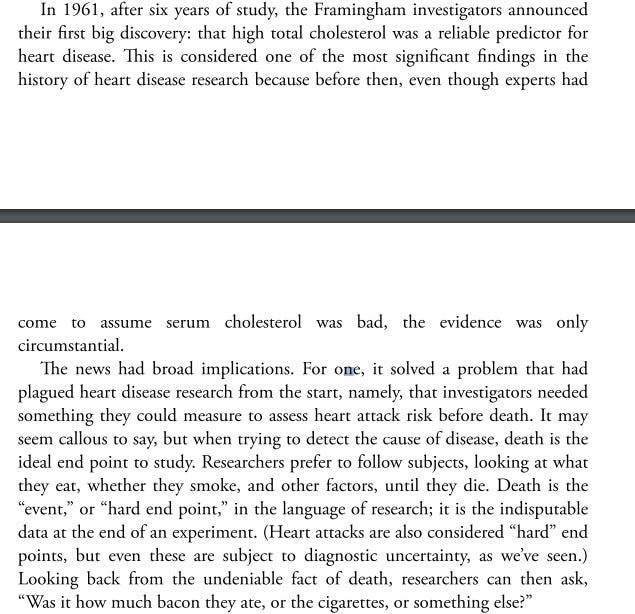
I’ve been reading the Big Fat Surprise for some time, and have parsed the following story from it: a dietitian named Ancel Keys became convinced that fat (particularly saturated fat) increases cholesterol intake, which increases atherosclerosis and then causes cardiovascular problems — the diet-heart hypothesis.
First, scientists found that replacing animal/saturated fats with vegetable/unsaturated fats decreased total cholesterol:
Lipid scientists in the 1950s were intensely focused on how these different kinds of fats affect various aspects of the blood, especially cholesterol levels, when eaten. At the Institute for Metabolic Research in Oakland, California, for instance, researchers first discovered in 1952 that replacing animal fats with vegetable fats would dramatically lower total cholesterol. A team at Harvard University found that the serum cholesterol levels of vegetarians were lower in those who ate no dairy products compared to those in people who ate eggs and milk. A Dutch study of vegetarians found the same.
Keys himself was not that interested in the effect of particular types of fat in comparison to total fat, though he did jump on that bandwagon later:
By the mid-1950s, Keys was beginning to back away from his idea that total fat was the principal cause of heart disease, although he didn’t acknowledge this explicitly. Instead, his papers start talking more about the type of dietary fat as the critical factor in raising cholesterol. Keys came to this conclusion after conducting a few small, short-term experiments on those same schizophrenic patients at a Minnesota hospital in 1957 and 1958. He found that serum cholesterol would go up after the men ate saturated fat and down after the vegetable oils, just as Ahrens and others had found earlier.
Thus, as Keys announced in a cluster of papers in top medical journals in 1957, total serum cholesterol could be reduced by cutting back on saturated fats.
This theory eventually became highly scrutinized. First, people found that there was little correlation between fat intake and cardiovascular mortality between countries:

This could be written off as an artefact of countries with high MUFA and PUFA intakes being lumped into the high fat category, though modern research also finds either no correlation between saturated fat intake and cardiovascular mortality between countries, or a negative one:

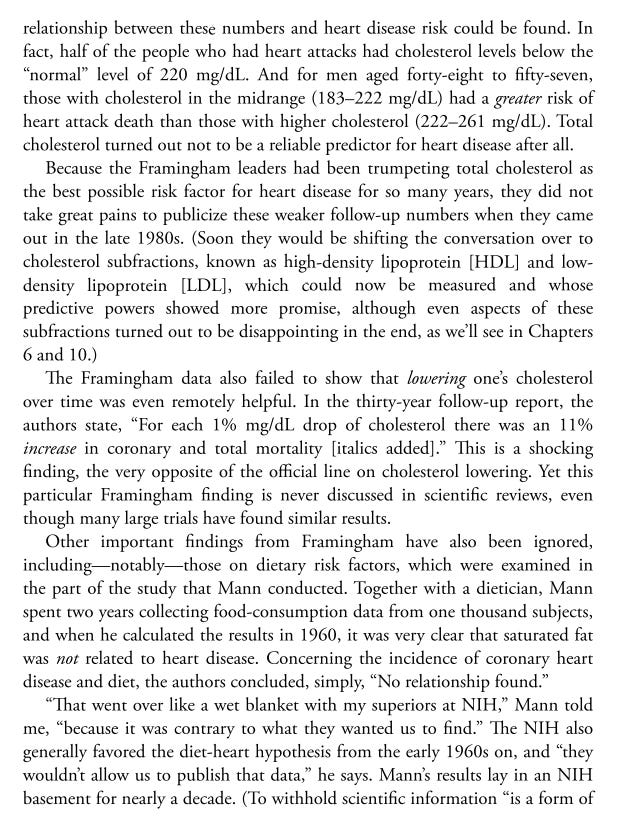
There is also the issue that the link between total cholesterol and heart disease was not as strong as was once thought, and that saturated fat itself did not predict it:

In terms of saturated fats, the RCTs conducted on SFA intake and cardiovascular disease are unconvincing, and, statistically speaking, barely differ from zero.
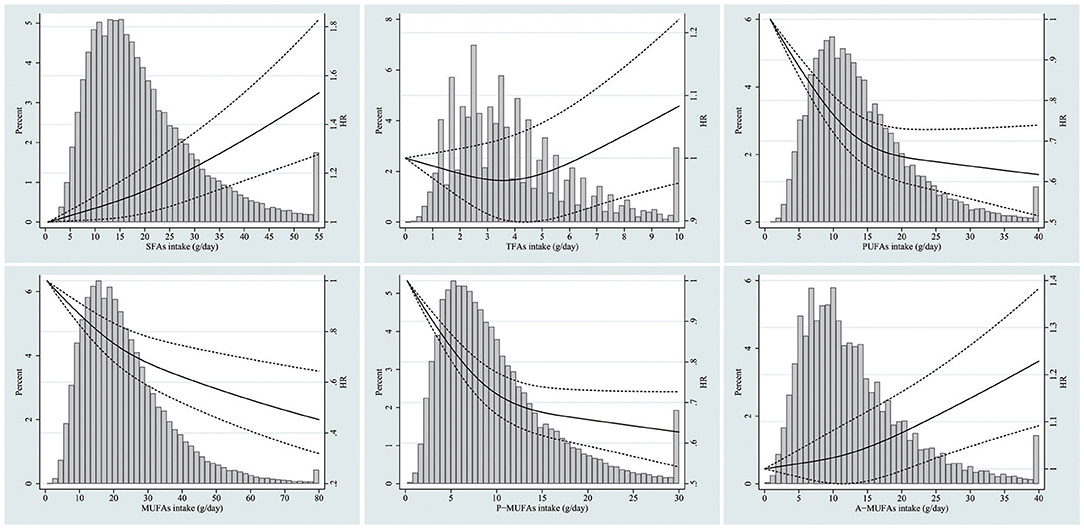
Cross-sectionally, saturated fat is related to slightly higher mortality rates — this can be seen in the meta-analysis, or in very large samples, though the relationship is not strong enough to justify restricting intake.
Cholesterol
Overly maligned. Nina touched on this a bit in the book I mentioned earlier, the Big Fat Surprise:
There was early evidence on animals that feeding them overly large amounts of cholesterol would give them heart attacks, but the same did not occur for animals that regularly eat meat, such as dogs:
Early evidence suggestively linking cholesterol to heart disease also came from animals. In 1913, the Russian pathologist Nikolaj Anitschkow reported that he could induce atherosclerotic-type lesions in rabbits by feeding them huge amounts of cholesterol. This experiment became quite famous and was widely replicated on all sorts of animals, including cats, sheep, cattle, and horses, leading to the widespread view that cholesterol in the diet—such as one finds in eggs, red meat, and shellfish—must cause atherosclerosis. Contemporaries noted that rabbits, along with most of the animals used in follow-up experiments, are all herbivores. Rhey therefore do not normally eat animal foods and are not biologically designed to metabolize them. By contrast, when the experiment was replicated on dogs (which eat meat as humans do), the animals demonstrated an ability to regulate and excrete extra cholesterol. The canine comparison seemed like a better model for humans, yet the original rabbit experiment had already riveted heart disease researchers, and cholesterol fixed itself as the principal suspect in the development of heart disease.
The idea that this applies to humans was also discarded:
One of the early ideas for how people might lower cholesterol was simply to consume less of it. The notion that cholesterol in the diet would translate directly into higher cholesterol in the blood just seemed intuitively reasonable, and was introduced by two biochemists from Columbia University in 1937. The assumption was that if we could avoid eating egg yolks and the like, we could prevent cholesterol from accumulating in the body. The idea is now lodged firmly in our minds: Indeed, how many brunch guests will demur at the sight of a plate of shirred eggs with a murmur about “too much cholesterol”?
It was Ancel Keys himself who first discredited this notion. Although in 1952 he stated that there was “overwhelming evidence” for the theory, he then found that no matter how much cholesterol he fed the volunteers in his studies, the cholesterol levels in their blood remained unchanged. He found that “tremendous” dosages of cholesterol added to the daily diet—up to 3,000 milligrams per day (a single large egg has just under 200 mg)—had only a “trivial” effect and by 1955, he had already decided that “this point requires no further consideration.”
Many other studies have reinforced this conclusion. In one case, when Uffe Ravnskov, a Swedish doctor, upped his consumption of eggs from one to eight per day (about 1,600 mg of cholesterol) for nearly a week, he made the remarkable discovery that his total cholesterol level went down. This, he later recorded in a book chapter called “Egg Consumption and Cholesterol Values in One Skeptical Swedish Doctor.” In fact, eating two to three eggs a day over a long period of time has never been shown to have more than a minimal impact on serum cholesterol for the vast majority of people. Remember that Mann would later find the Masai to have extremely low serum cholesterol on average, despite a diet composed entirely of milk, meat, and blood. In 1992, one of the most comprehensive analyses of this subject concluded that the vast majority of people will react to even a great deal of cholesterol in the diet by ratcheting down the amount of cholesterol the body itself produces. In other words, the body seeks to keep its internal conditions constant. In the same way that the body excretes sweat to lower body temperature, the process of homeostasis is constantly returning the internal conditions of the body— cholesterol levels included—to a state where all biological systems can function optimally.
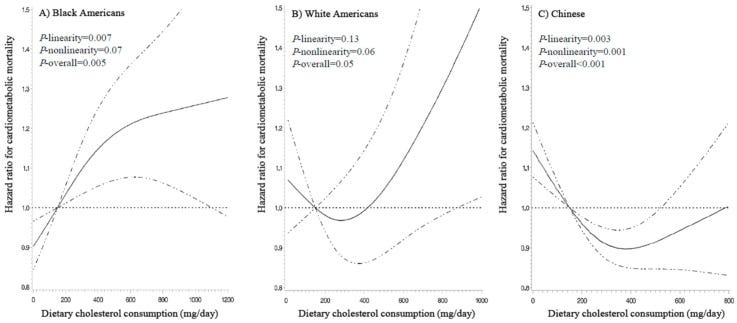
Cross-sectionally, the optimal dose of cholesterol per day seems to be about 300mg per day in Whites and Asians:
Many people report eating extremely high amounts of cholesterol (e.g. pure raw egg or carnivore diet) and feel fine with good biomarkers, though I don’t think a diet with that much cholesterol in the long term would be healthy for most.
Fiber
More unambiguously seems to be better. I wouldn’t go for something crazy like 50g a day, but the recommendations from governments to eat 20-30g a day are born out in fact. Cross-sectionally, it is always linked to reduced mortality and eating a high fiber diet seems to be a fairly effective longevity intervention.
Protein
Cross-sectionally, mortality decreases with protein intake until protein reaches about 15% of calories ingested, which would be 80g for a 2200 calorie diet. Given that most of the negativity online is directed towards fat and carbs and not protein, I’m not inclined to question the results.
There’s one guy who claims that humans only need 44g of protein, based on the fact that as protein intake rises to 44g, 75% of the amino acids are excreted in urine, a hasty conclusion — he does not know when that number approaches 100%, which would indicate that additional protein is completely useless.
Vitamin B1
Cross-sectionally, intake is associated with lower mortality and diminishing returns appear to kick in around 1-2mg a day. Based on studies of urinary excretion, the bare minimum intake to avoid deficiency is 0.66 mg a day, though I am inclined to view that recommendation as overly conservative (which the authors imply in their abstract).
Conventional wisdom holds that there is no upper limit of toxic intake, though I would be reticent about supplementing with extremely large amounts of it (e.g. >150mg).
Vitamin B2
Not much information online about this vitamin, and deficiency in it is rare, so I did not bother researching the optimal level of intake in too much depth. From what I can see in this book, once humans hit an intake of 1mg per day, most of the surplus B2 intake is then excreted in urine. I am inclined to put the minimum dose at 1.2 and the ideal dose at 1.5.
 and Horwitt et al. (1950).")
Vitamin B3
A fairly controversial vitamin. Greater intake is consistently associated with lower mortality, even past 35mg which is the upper limit on intake that most institutions place on it, mostly due to the fact that high intakes of it lead to flushing. Conservatively, I would place the limit at right below the flushing occurs — institutions claim that the flushing is uncomfortable but harmless, but I can’t help but feel like having your skin flush because your blood vessels are dilating too much is not a good thing.
There are forms of B3 that do not cause flushing such as nicotinamide, though I still feel reticent to ascribe an ideal dose above what can be achieved from diet alone in the absence of more solid evidence.
Overall, I would recommend high intake but would not recommend intake past 50mg due to the fact that it can lead to adverse effects.
Vitamin B5
One study found that excretion was less than intake in their 8 subjects when dietary intake was 7.8 mg per day, so I set that to be the ideal level of intake. Minimum intake was taken to be the US RDA.
Vitamin B6
Based on the cross-sectional mortality correlation.
Vitamin B12
Excess B12 intake is associated with slightly higher rates of mortality. I doubt B12 actually kills people, so I think it is an artefact of confounding with diet. This book suggests that the bare minimum dose to avoid deficiency is 1.5 μg/day, though I am inclined to think (and the authors as well) that is far too conservative. I placed the ideal dose at 3.4 μg/day, which is roughly what the average American consumes every day.
Folate
Based on the cross-sectional mortality correlation.
Vitamin A
Overall, serum levels of vitamin A are associated with lower mortality, but levels that are too high are associated with increased risk of mortality. The serum level associated with the least mortality are at about the 85th percentile of the population, so I assumed the same was true for intake, where the 85th percentile in intake is ~900µg per day. I placed the minimum dose at just below the average.
Vitamin C
Cross-sectionally, the diminishing returns start to kick in at about 150mg per day when it comes to preventing mortality. When it comes to raising serum levels, the diminishing returns start to kick in at around 200mg. I placed the ideal dose at 200mg and the minimum dose at the US RDA (averaged for men and women), which is 80mg.
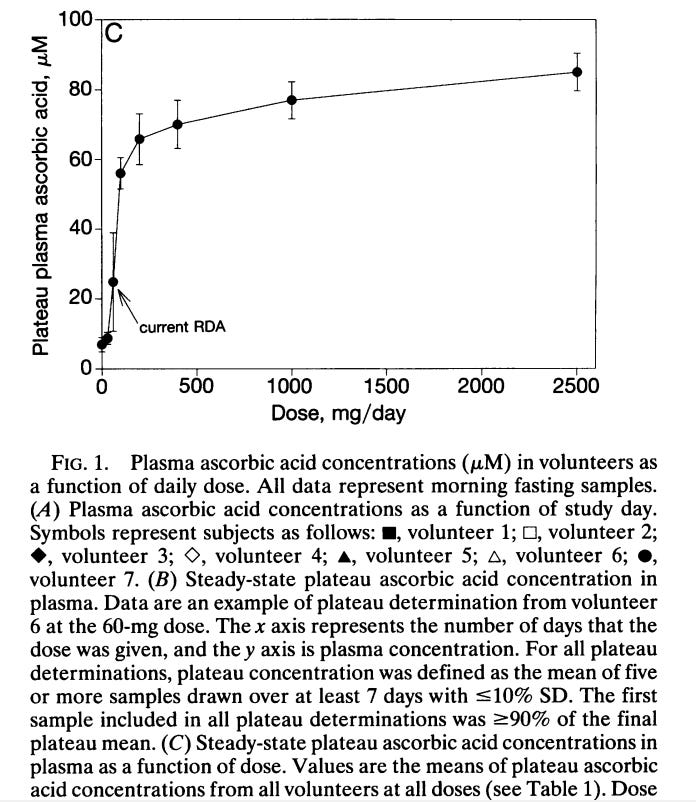
Apparently it reaches saturation at about 70-80µM, and most sources on the internet claim that complete saturation is achieved at 200mg, so I’ll set that to the ideal dose, and 100mg to the minimum dose.
Vitamin D
Another controversial one. I’m inclined to think more is better just like everybody else, but the devil is in the upper dose. Regulatory agencies generally recommend a low dose of vitamin D per day (~600IU), and have upper limits of about 4k IU. However, these limits are not based on evidence.
There are some studies that correlate serum vitamin D levels and all-cause mortality, one of which finds a non-linear association between serum levels of vitamin D and mortality:
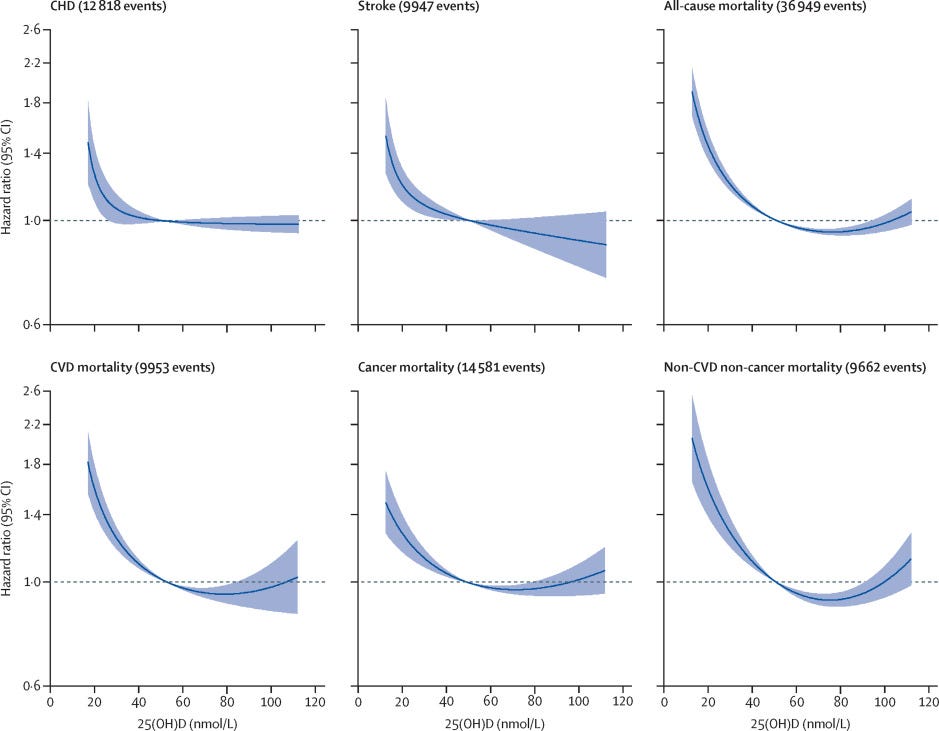
In some cases this finding replicates [1], but in most cases it does not [1], [2], [3], [4]; I’m inclined to trust the results of the latter.
Mechanistically, the main concern with high levels of is hypercalcemia:
An excess of vitamin D causes abnormally hypercalcaemia (high blood concentrations of calcium), which can cause overcalcification of the bones and soft tissues including arteries, heart, and kidneys. Untreated, this can lead to irreversible kidney failure. Symptoms of vitamin D toxicity may include the following: increased thirst, increased urination, nausea, vomiting, diarrhea, decreased appetite, irritability, constipation, fatigue, muscle weakness, and insomnia. In almost every case, stopping the vitamin D supplementation combined with a low-calcium diet and corticosteroid drugs will allow for a full recovery within a month.[66][67][68]
Here’s the catch: you can just supplement with K2 MK7 to avoid hypercalcemia (conventional wisdom on the internet is 100µg of K2 for 5000 IU of D3), as it diverts excess calcium to the bones rather than tissues and arteries.
The body can synthesize about 25000 IU of vitamin D from the sunlight, it would be odd if a dose under this amount would be toxic to humans. In terms of supplement tolerance, one study that supplemented 4700 patients with vitamin D deficiency in a hospital setting with vitamin D3, most with 5-10k UIs, but a few with doses of as high as 50k and found no evidence of hypercalcemia after several years of dosage.
Vitamin E
Based on the cross-sectional mortality correlation. 18mg is difficult to reach without supplements, but it the optimal E intake scales with PUFAs; if you have less PUFAs then their oxidization is not as necessary to prevent.
Vitamin K
Daily ingestion and mortality are negatively associated, and it is not clear where the diminishing returns hit, so I placed the ideal dose at the level where lower mortality risk was still evident (500µg) and the minimum dose at around when the curve starts to flatter (100µg).
Calcium
Based on the cross-sectional mortality correlation.
Iron
Daily ingestion and mortality are negatively associated, and the diminishing returns kick in around 10-15mg. Most dietary agencies recommend higher levels of intake for women, though only a bit of iron is lost in menstruation and women absorb iron more easily than men do. I placed the minimum and ideal doses slighly below what I otherwise would because there is some evidence that iron is neurotoxic and accelerates the aging process.
Cross-sectionally, excess iron intake is linked to lower IQ after controlling for age, squared age, sex, race, marriage status, education, physical activity, household income, smoking status, alcohol drinking status, use of vitamin/iron/zinc supplements, and dietary intake levels of fat/fiber.


Not sure whether it is actually true that iron lowers IQ, but there is a pretty big body of research that implicates the role of iron accumulation in dementia.
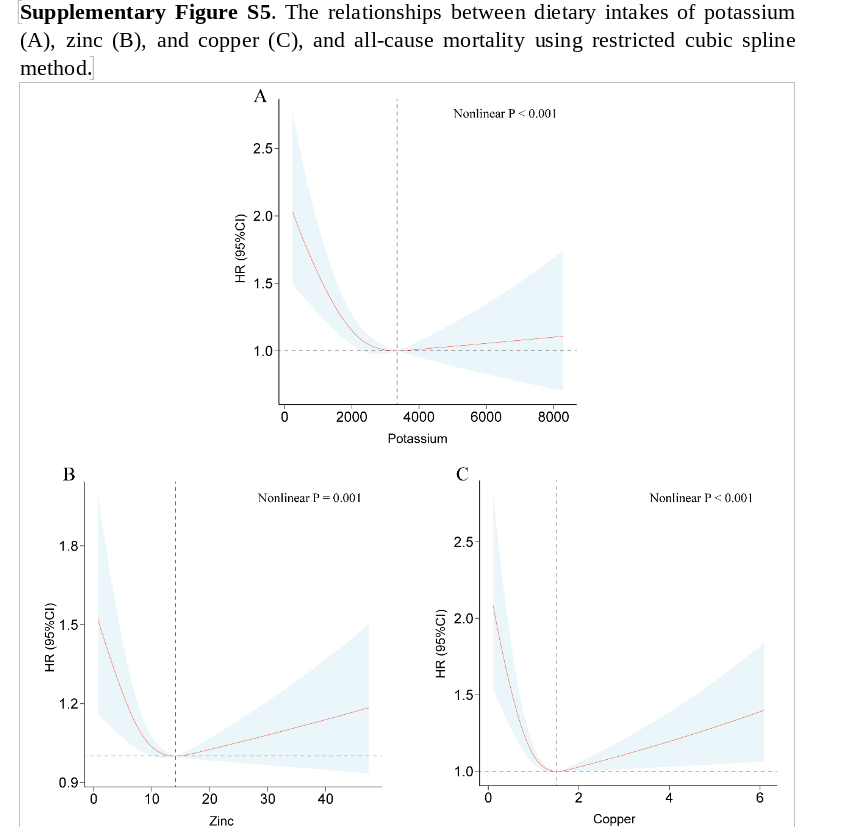
Copper
Daily ingestion and mortality are negatively associated, and it is not clear where the diminishing returns. I conservatively estimated the ideal dose to be 1.5mg and the minimum dose to be 1mg due to its potentially neurotoxic effects.
Magnesium
Based on the cross-sectional mortality correlation.
Phosphorus
Based on the cross-sectional mortality correlation.
Potassium
Based on the cross-sectional mortality correlation.
Sodium
The idea that salt kills you is a myth. Salt deficiency, in fact, seems to be the more reliable killer than salt excess. Doses set to 2000mg and 3000mg. Worth mentioning that salt poisoning can kill you, even in doses as low as 13g.
Chloride
Institutions set their chloride RDAs to mirror their sodium RDAs, so I followed their example.
Iodine
I based the recommendation on what levels were most optimal for childbirth. Not exactly the most scientific way to do it, but it was close to the US RDA anyway.
Zinc
Based on the cross-sectional mortality correlation.
Selenium
Based on the cross-sectional mortality correlation.
Manganese
The dose to avoid deficiency seems to be about 2mg; raised the ideal dose to 4mg as historical human populations seem to have higher levels of consumption than modern ones.
Notes and studies
This one is based on the UK Biobank, and estimates the non-linear effects of various energy sources on all-cause mortality:
Ho, F. K., Gray, S. R., Welsh, P., Petermann-Rocha, F., Foster, H., Waddell, H., … Celis-Morales, C. (2020). Associations of fat and carbohydrate intake with cardiovascular disease and mortality: prospective cohort study of UK Biobank participants. BMJ, m688. doi:10.1136/bmj.m688
4780 (2.4%) participants died over a mean 10.6 (range 9.4-13.9) years of follow-up, and 948 (0.5%) and 9776 (5.0%) experienced fatal and non-fatal CVD events, respectively, over a mean 9.7 (range 8.5-13.0) years of follow-up. Non-linear associations were found for many macronutrients. Carbohydrate intake showed a non-linear association with mortality; no association at 20-50% of total energy intake but a positive association at 50-70% of energy intake (3.14 v 2.75 per 1000 person years, average hazard ratio 1.14, 95% confidence interval 1.03 to 1.28 (60-70% v 50% of energy)). A similar pattern was observed for sugar but not for starch or fibre. A higher intake of monounsaturated fat (2.94 v 3.50 per 1000 person years, average hazard ratio 0.58, 0.51 to 0.66 (20-25% v 5% of energy)) and lower intake of polyunsaturated fat (2.66 v 3.04 per 1000 person years, 0.78, 0.75 to 0.81 (5-7% v 12% of energy)) and saturated fat (2.66 v 3.59 per 1000 person years, 0.67, 0.62 to 0.73 (5-10% v 20% of energy)) were associated with a lower risk of mortality. A dietary risk matrix was developed to illustrate how dietary advice can be given based on current intake.
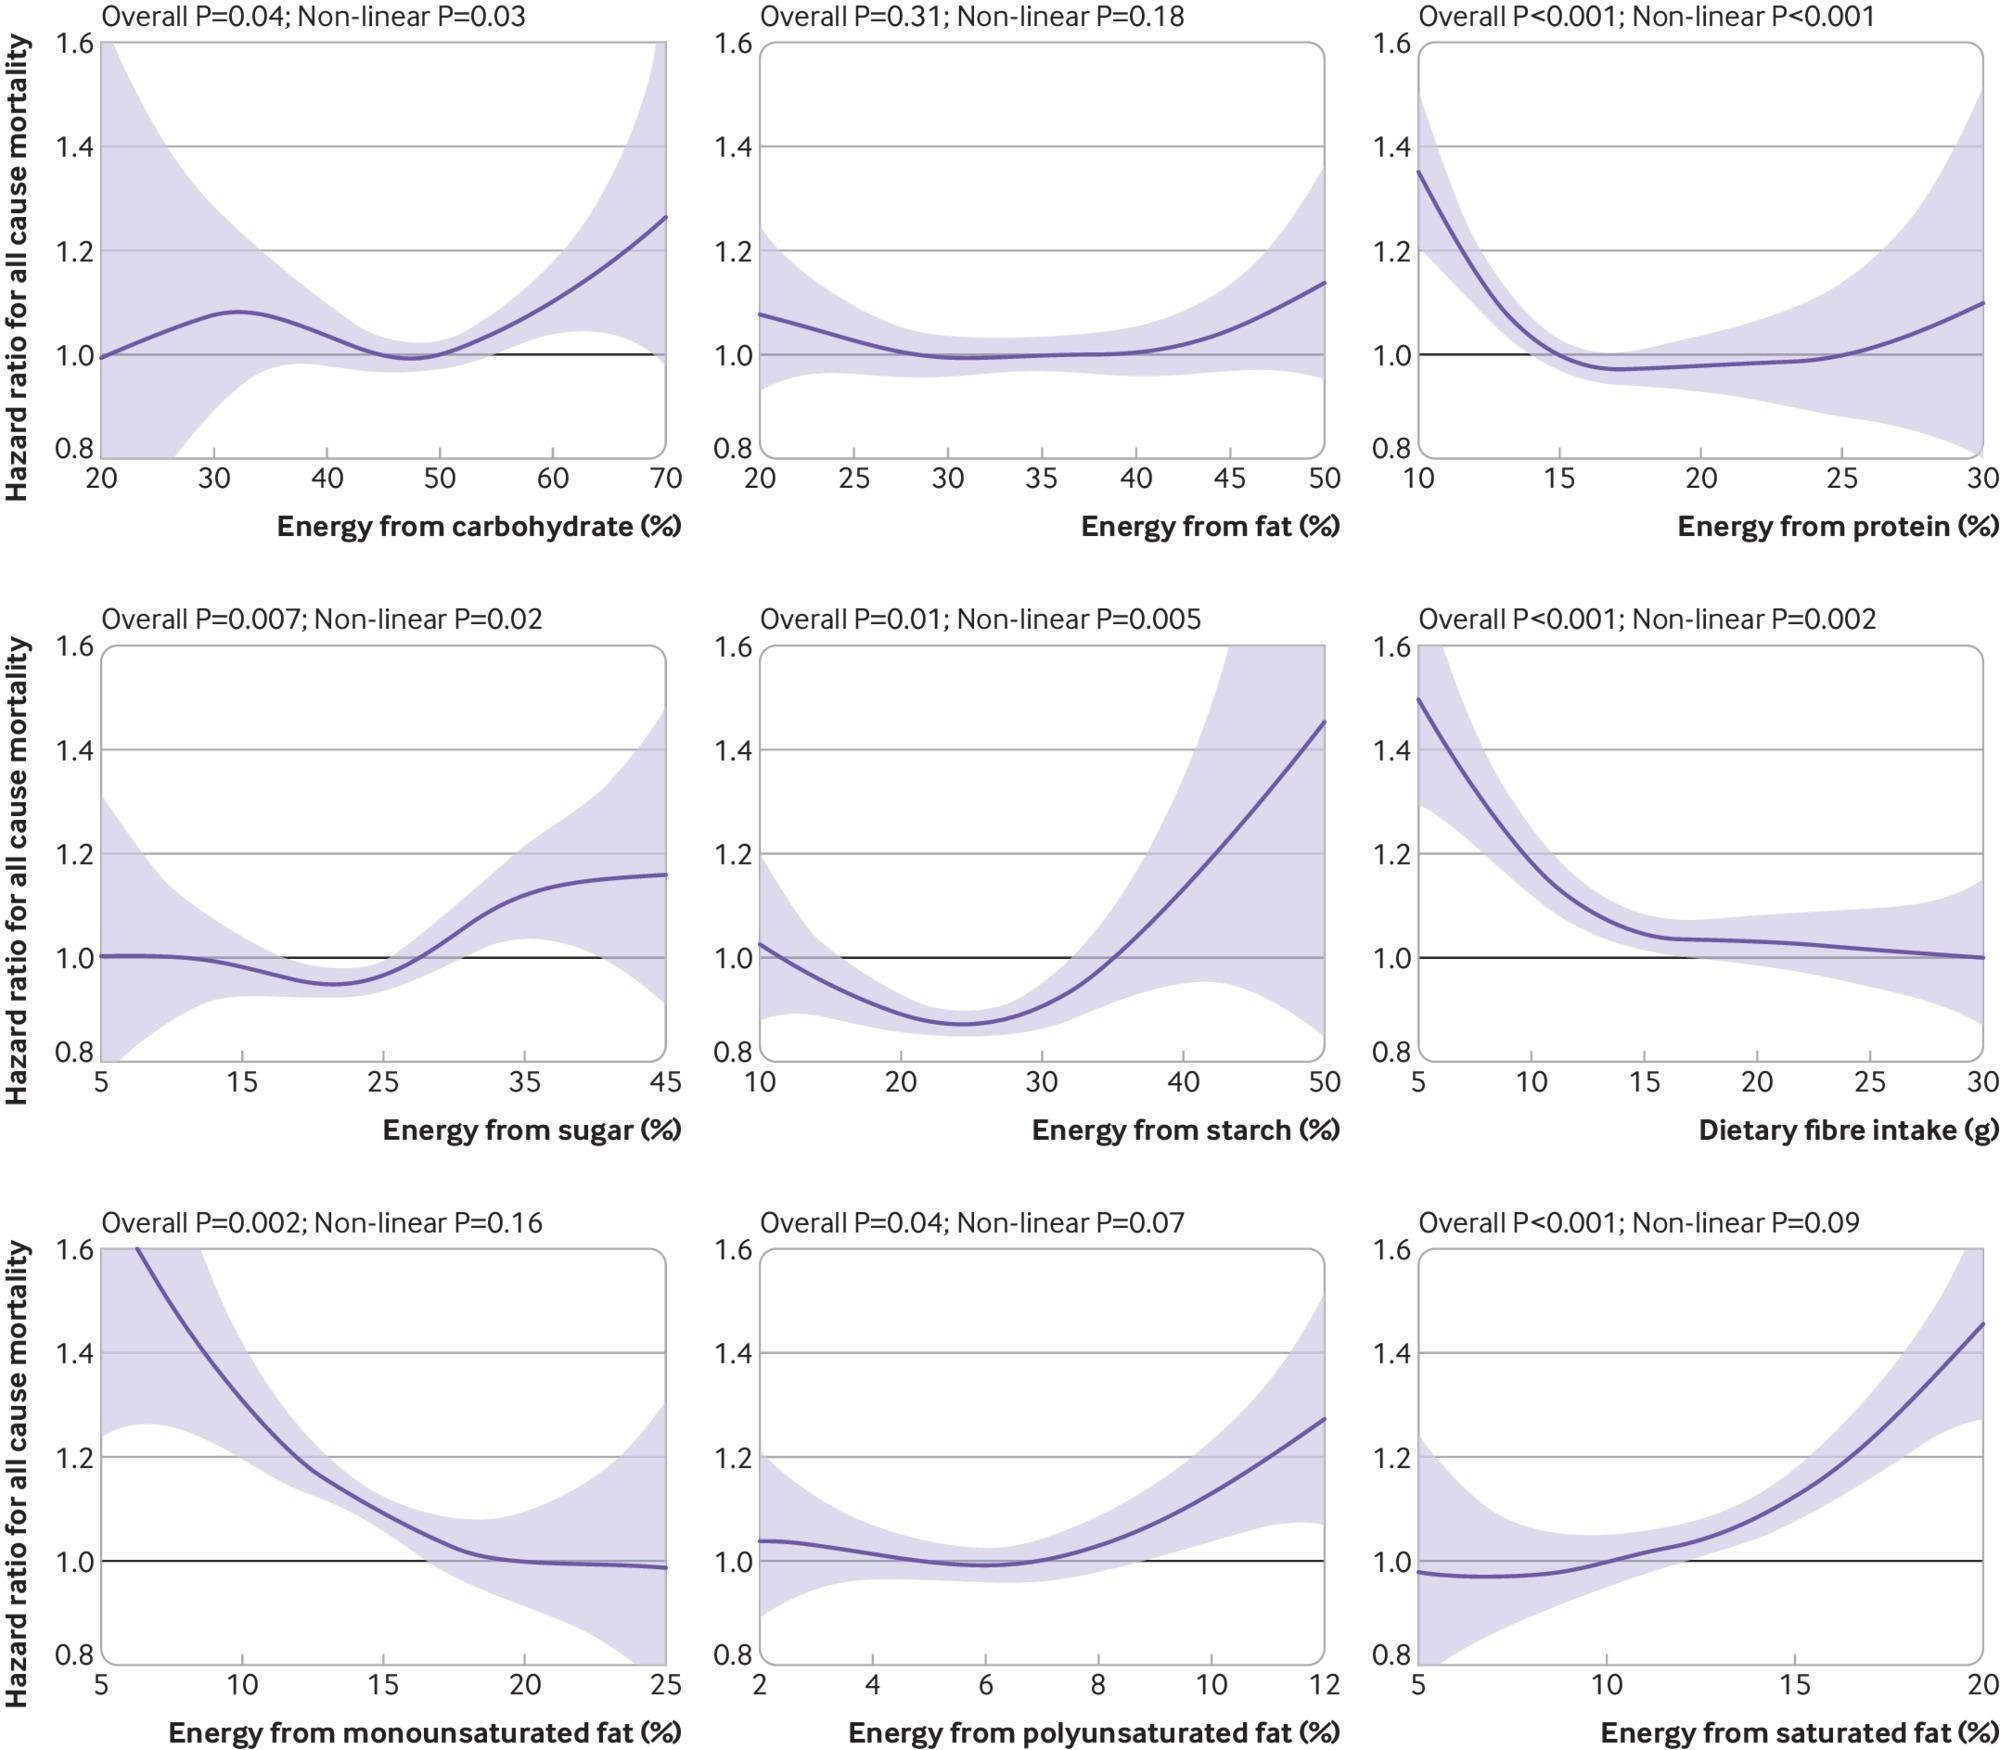
Mostly expected results, though I question whether the association between saturated fat and mortality is causal based on other observational studies and RCTs.
Large review on SFA and mortality:
Valk R, Hammill J, Grip J. Saturated fat: villain and bogeyman in the development of cardiovascular disease? Eur J Prev Cardiol. 2022 Dec 21;29(18):2312-2321. doi: 10.1093/eurjpc/zwac194. PMID: 36059207.
Methods and results: PubMed, Google scholar, and Scopus were searched for articles published between 2010 and 2021 on the association between SFA consumption and CVD risk and outcomes. A review was conducted examining observational studies and prospective epidemiologic cohort studies, randomized controlled trials (RCTs), systematic reviews and meta-analyses of observational studies and prospective epidemiologic cohort studies, and long-term RCTs. Collectively, neither observational studies, prospective epidemiologic cohort studies, RCTs, systematic reviews, and meta-analyses have conclusively established a significant association between SFA in the diet and subsequent cardiovascular risk and coronary artery disease, myocardial infarction, or mortality nor a benefit of reducing dietary SFAs on CVD rick, events, and mortality. Beneficial effects of replacement of SFA by polyunsaturated or monounsaturated fat or carbohydrates remain elusive.
Conclusion: Findings from the studies reviewed in this paper indicate that the consumption of SFA is not significantly associated with CVD risk, events, or mortality. Based on the scientific evidence, there is no scientific ground to demonize SFA as a cause of CVD. SFA naturally occurring in nutrient-dense foods can be safely included in the diet.

Looks fairly convincing.
Massive meta-analysis on saturated fat and mortality:
Reynolds A, Hodson L, de Souza R, Tran Diep Pham H, Vlietstra L, Mann J. Saturated fat and trans-fat intakes and their replacement with other macronutrients: a systematic review and metaanalysis of prospective observational studies. Geneva: World Health Organization; 2022. Licence: CC BY-NCSA 3.0 IGO.
There were 112 publications (3 696 568 participants) relating to SFA and 55 publications (2 227 241 participants) relating to TFA and prespecified health outcomes. Higher dietary intakes of SFA were associated with increased mortality. Mortality reduced when 5% of total energy from SFA was replaced with polyunsaturated fats (PUFA; relative risk [RR] 0.85; 95% confidence interval [CI]: 0.75 to 0.97), monounsaturated fats (MUFA; RR: 0.84; 95% CI: 0.75 to 0.95), plant MUFA (RR: 0.85; 95% CI: 0.82 to 0.88) and carbohydrates (RR: 0.92; 95% CI: 0.86 to 0.99). Coronary heart disease (CHD) incidence reduced with a 5% energy replacement with PUFA (RR: 0.89; 95% CI: 0.81 to 0.98), plant MUFA (RR: 0.83; 95% CI: 0.69 to 1.00) and slowly digested carbohydrates (RR: 0.94; 95% CI: 0.89 to 0.99). Higher tissue measures of total SFA were associated with increased CHD and type 2 diabetes incidence. Higher dietary intakes of TFA were associated with increased mortality, CHD and cardiovascular disease. A 2% replacement of TFA with plant MUFA reduced mortality (RR: 0.90; 95% CI: 0.85 to 0.96) and CHD (RR: 0.80; 95% CI: 0.70 to 0.92). The certainty of evidence was graded from moderate to very low, largely due to the amount of data available.

A different study on the same topic:
Dehghan, M., Mente, A., Zhang, X., Swaminathan, S., Li, W., Mohan, V., … Rosengren, A. (2017). Associations of fats and carbohydrate intake with cardiovascular disease and mortality in 18 countries from five continents (PURE): a prospective cohort study. The Lancet, 390(10107), 2050–2062. doi:10.1016/s0140-6736(17)32252-3
During follow-up, we documented 5796 deaths and 4784 major cardiovascular disease events. Higher carbohydrate intake was associated with an increased risk of total mortality (highest [quintile 5] vs lowest quintile [quintile 1] category, HR 1·28 [95% CI 1·12–1·46], ptrend=0·0001) but not with the risk of cardiovascular disease or cardiovascular disease mortality. Intake of total fat and each type of fat was associated with lower risk of total mortality (quintile 5 vs quintile 1, total fat: HR 0·77 [95% CI 0·67–0·87], ptrend<0·0001; saturated fat, HR 0·86 [0·76–0·99], ptrend=0·0088; monounsaturated fat: HR 0·81 [0·71–0·92], ptrend<0·0001; and polyunsaturated fat: HR 0·80 [0·71–0·89], ptrend<0·0001). Higher saturated fat intake was associated with lower risk of stroke (quintile 5 vs quintile 1, HR 0·79 [95% CI 0·64–0·98], ptrend=0·0498). Total fat and saturated and unsaturated fats were not significantly associated with risk of myocardial infarction or cardiovascular disease mortality

Different results — MFA intake is still associated with lower mortality, but now this applies to all fats, and now it is carbs that are associated with high mortality.
A third study:
Yao X, Xu X, Wang S and Xia D (2021) Associations of Dietary Fat Intake With Mortality From All Causes, Cardiovascular Disease, and Cancer: A Prospective Study. Front. Nutr. 8:701430. doi: 10.3389/fnut.2021.701430
Overall, 24,141 deaths were recorded over a total 1,672,715 person-years of follow-up. There was a significant positive association between SFA consumption and total mortality (HRQ5 vs. Q1 = 1.13, 95% CI 1.05–1.22; Pfor trend < 0.001). PUFA intake was strongly inversely associated with total mortality (HRQ5 vs. Q1 = 0.79, 95% CI 0.73–0.85; Pfor trend < 0.001) and CVD mortality (HRQ5 vs. Q1 = 0.66, 95% CI 0.58–0.75; Pfor trend < 0.001). There was a similar, but to a lesser extent, association between MUFA intake and total and CVD mortality [HRQ5 vs. Q1 0.91 (95% CI: 0.84–0.99), Pfor trend = 0.044 and 0.85 (0.73–0.98), Pfor trend = 0.020, respectively]. None of these types of dietary fat were associated with cancer mortality (all Pfor trend > 0.05). In conclusion, this study observed a detrimental effect of SFA intake on total mortality; in contrast, greater consumption of PUFAs and MUFAs were associated with lower risks of all-cause death and CVD mortality.
This one looks at specific food types instead:
Schwingshackl, L., Schwedhelm, C., Hoffmann, G., Lampousi, A.-M., Knüppel, S., Iqbal, K., … Boeing, H. (2017). Food groups and risk of all-cause mortality: a systematic review and meta-analysis of prospective studies. The American Journal of Clinical Nutrition, ajcn153148. doi:10.3945/ajcn.117.153148
With increasing intake (for each daily serving) of whole grains (RR: 0.92; 95% CI: 0.89, 0.95), vegetables (RR: 0.96; 95% CI: 0.95, 0.98), fruits (RR: 0.94; 95% CI: 0.92, 0.97), nuts (RR: 0.76; 95% CI: 0.69, 0.84), and fish (RR: 0.93; 95% CI: 0.88, 0.98), the risk of all-cause mortality decreased; higher intake of red meat (RR: 1.10; 95% CI: 1.04, 1.18) and processed meat (RR: 1.23; 95% CI: 1.12, 1.36) was associated with an increased risk of all-cause mortality in a linear dose-response meta-analysis. A clear indication of nonlinearity was seen for the relations between vegetables, fruits, nuts, and dairy and all-cause mortality. Optimal consumption of risk-decreasing foods results in a 56% reduction of all-cause mortality, whereas consumption of risk-increasing foods is associated with a 2-fold increased risk of all-cause mortality


Nothing too interesting here. Cofnas, prior to becoming the race science political scientist he is now, was known for advocating that red meat was nowhere near as bad as people think it is. I’m inclined to agree, though I would caution against eating too much meat regardless.
Cholesterol:
Pan, Xiongfei & Yang, Jae Jeong & Lipworth, Loren & Shu, Xiao-Ou & Cai, Hui & Steinwandel, Mark & Blot, William & Zheng, Wei & Yu, Danxia. (2021). Cholesterol and Egg Intakes with Cardiometabolic and All-Cause Mortality among Chinese and Low-Income Black and White Americans. Nutrients. 13. 2094. 10.3390/nu13062094.
We examined the associations of dietary cholesterol and egg intakes with cardiometabolic and all-cause mortality among Chinese and low-income Black and White Americans. Included were 47,789 Blacks, 20,360 Whites, and 134,280 Chinese aged 40-79 years at enrollment. Multivariable Cox models with restricted cubic splines were applied to estimate hazard ratios (HRs) and 95% confidence intervals (CIs) for mortality outcomes using intakes of 150 mg cholesterol/day and 1 egg/week as the references. Cholesterol intake showed a nonlinear association with increased all-cause mortality and a linear association with increased cardiometabolic mortality among Black Americans: HRs (95% CIs) associated with 300 and 600 mg/day vs. 150 mg/day were 1.07 (1.03-1.11) and 1.13 (1.05-1.21) for all-cause mortality (P-linearity = 0.04, P-nonlinearity = 0.002, and P-overall < 0.001) and 1.10 (1.03-1.16) and 1.21 (1.08-1.36) for cardiometabolic mortality (P-linearity = 0.007, P-nonlinearity = 0.07, and P-overall = 0.005). Null associations with all-cause or cardiometabolic mortality were noted for White Americans (P-linearity ≥ 0.13, P-nonlinearity ≥ 0.06, and P-overall ≥ 0.05 for both). Nonlinear inverse associations were observed among Chinese: HR (95% CI) for 300 vs. 150 mg/day was 0.94 (0.92-0.97) for all-cause mortality and 0.91 (0.87-0.95) for cardiometabolic mortality, but the inverse associations disappeared with cholesterol intake > 500 mg/day (P-linearity ≥ 0.12; P-nonlinearity ≤ 0.001; P-overall < 0.001 for both). Similarly, we observed a positive association of egg intake with all-cause mortality in Black Americans, but a null association in White Americans and a nonlinear inverse association in Chinese. In conclusion, the associations of cholesterol and egg intakes with cardiometabolic and all-cause mortality may differ across ethnicities who have different dietary patterns and cardiometabolic risk profiles. However, residual confounding remains possible.

Relationship may depend on race — optimal intake appears to be 300mg for non-Blacks and low amounts for Blacks.
A second study:
Xia, P. F., Pan, X. F., Chen, C., Wang, Y., Ye, Y., & Pan, A. (2020). Dietary Intakes of Eggs and Cholesterol in Relation to All-Cause and Heart Disease Mortality: A Prospective Cohort Study. Journal of the American Heart Association, 9(10), e015743. https://doi.org/10.1161/JAHA.119.015743
No significant association was found between egg consumption and mortality in US adults. The association between dietary cholesterol intake and all‐cause mortality depended on the baseline intake levels, with an inverse association in those with lower intake levels (<250 mg/day) but a positive association in those with higher intake levels (≥250 mg/day).
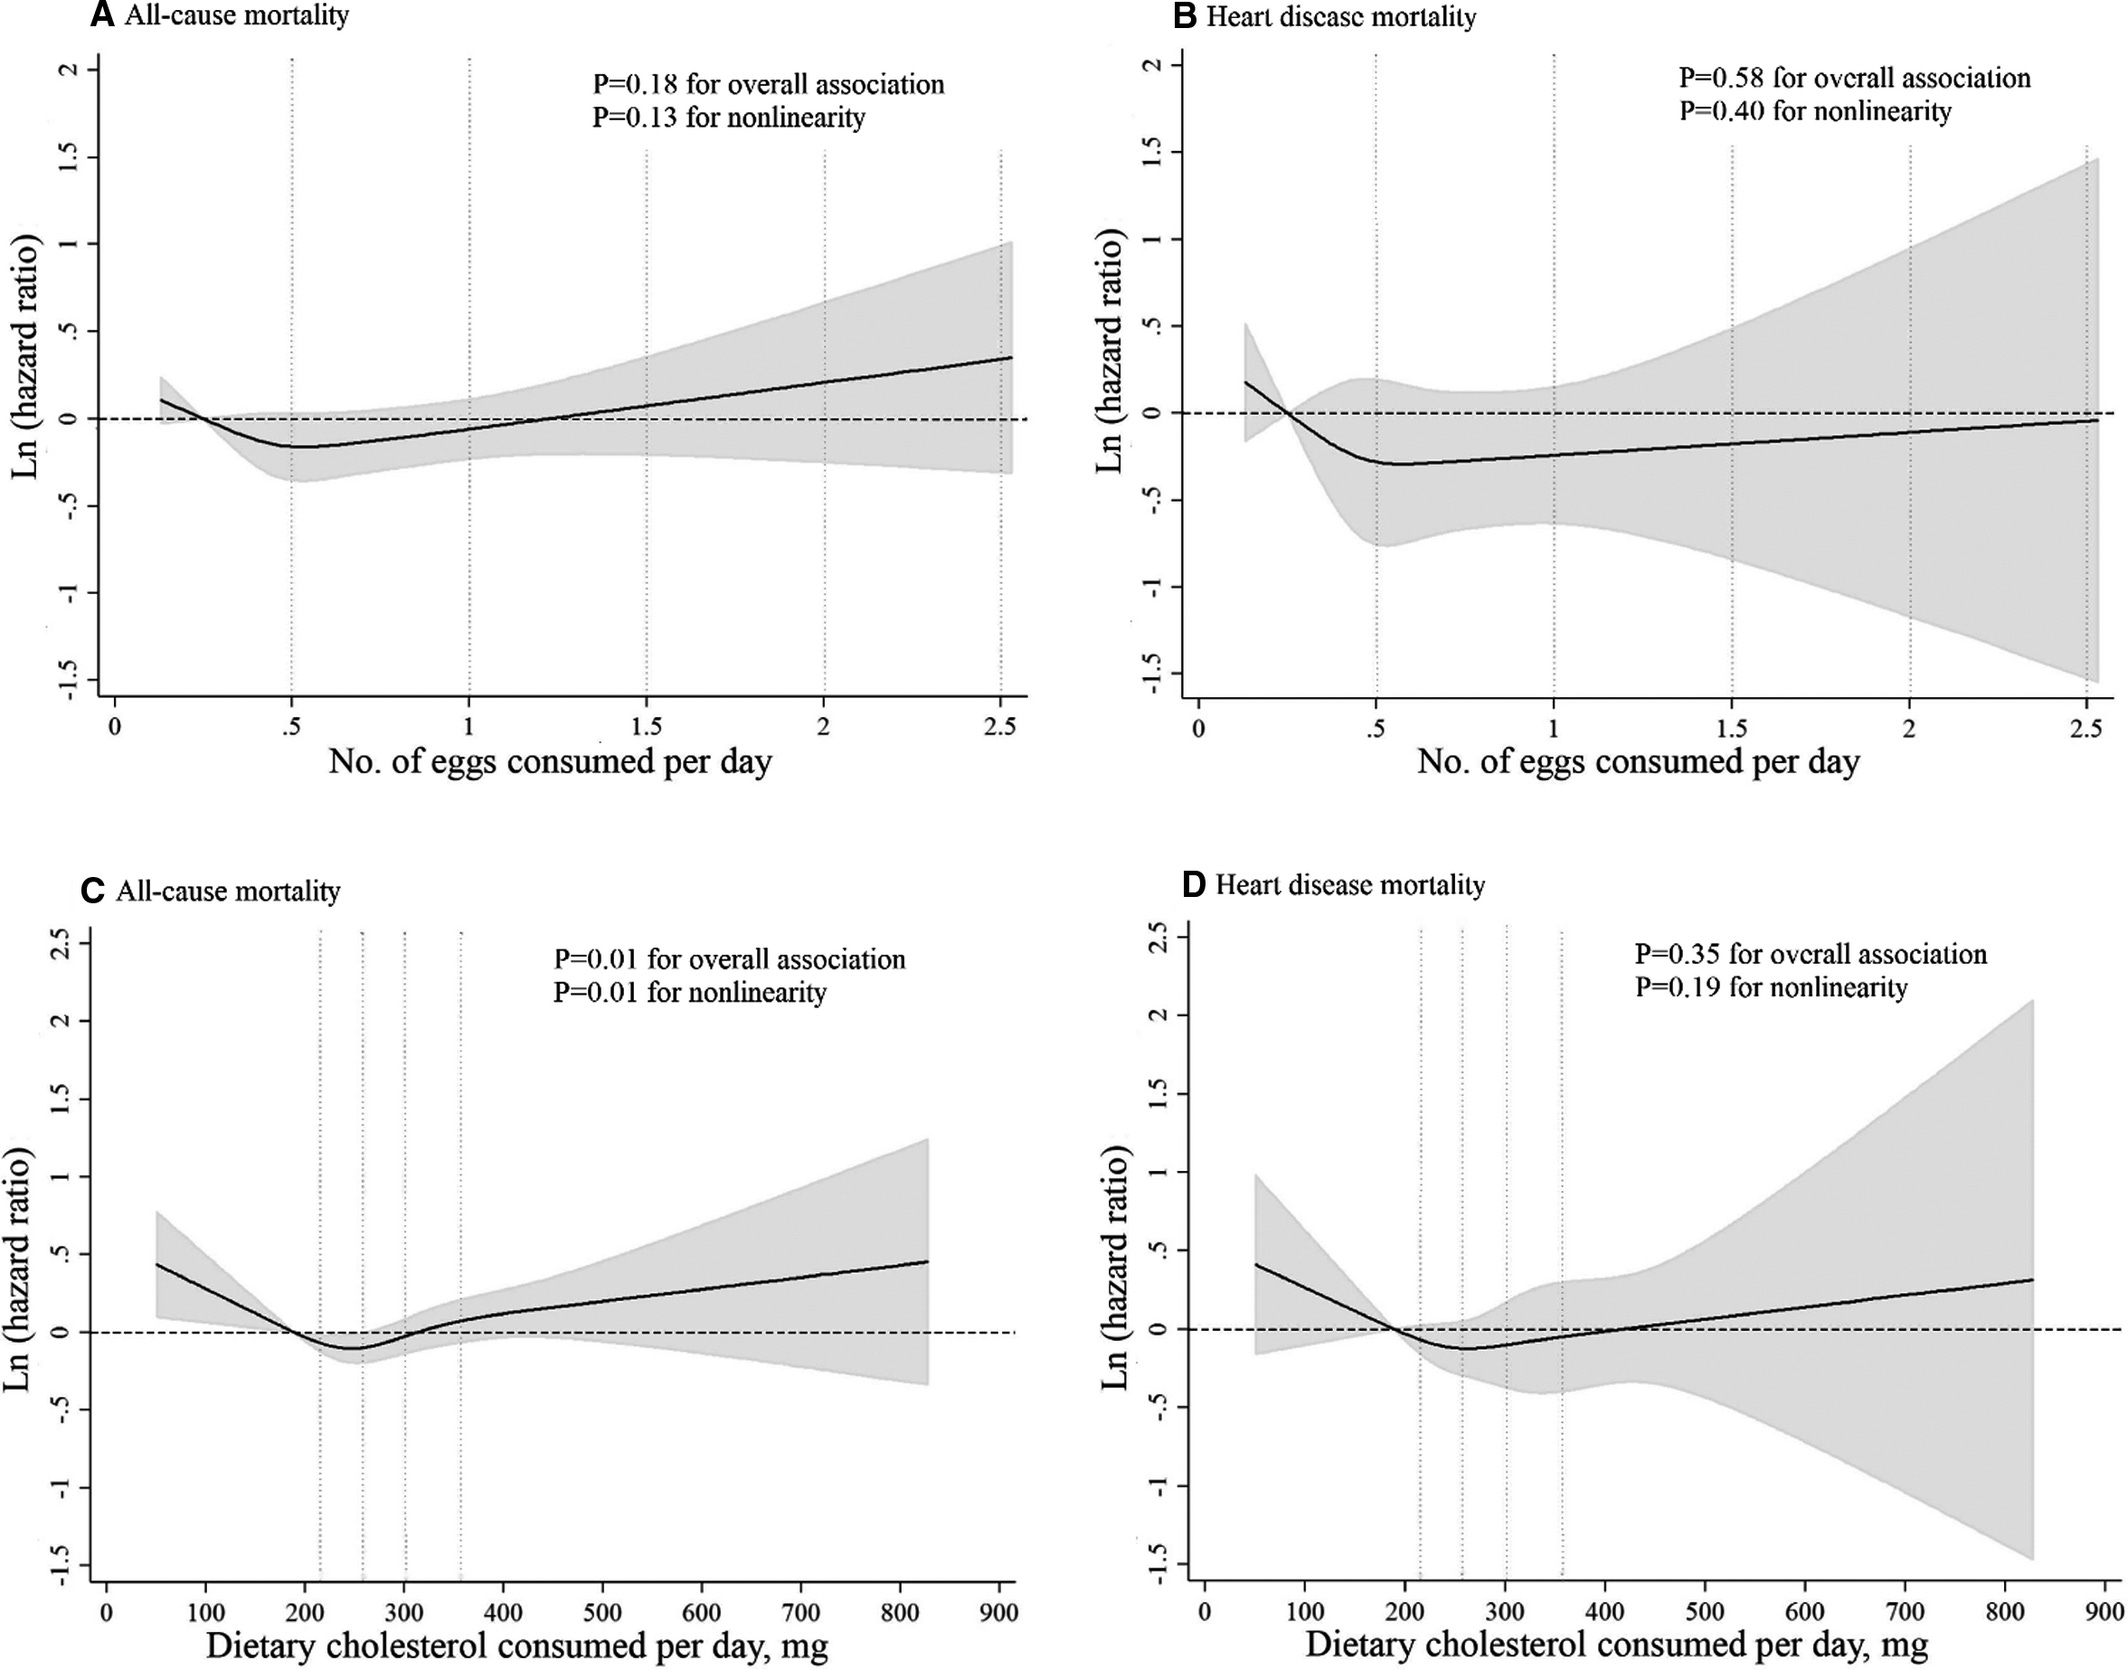
For now, I’ll set the minimum at 150mg, recommended dose at 300mg, and maximum dose at 700mg.
For omega 3 serum levels:
Harris, W.S., Tintle, N.L., Imamura, F. et al. Blood n-3 fatty acid levels and total and cause-specific mortality from 17 prospective studies. Nat Commun 12, 2329 (2021). https://doi.org/10.1038/s41467-021-22370-2
The health effects of omega-3 fatty acids have been controversial. Here we report the results of a de novo pooled analysis conducted with data from 17 prospective cohort studies examining the associations between blood omega-3 fatty acid levels and risk for all-cause mortality. Over a median of 16 years of follow-up, 15,720 deaths occurred among 42,466 individuals. We found that, after multivariable adjustment for relevant risk factors, risk for death from all causes was significantly lower (by 15–18%, at least p < 0.003) in the highest vs the lowest quintile for circulating long chain (20–22 carbon) omega-3 fatty acids (eicosapentaenoic, docosapentaenoic, and docosahexaenoic acids). Similar relationships were seen for death from cardiovascular disease, cancer and other causes. No associations were seen with the 18-carbon omega-3, alpha-linolenic acid. These findings suggest that higher circulating levels of marine n-3 PUFA are associated with a lower risk of premature death.

Assuming a 1:1 relationship between dose and serum levels, it seems the idealdose of fish oil is at about the 90th percentile of the general population — the nonlinear EPA association does not replicate very well
PUFA ratios:
Higher ratio of plasma omega-6/omega-3 fatty acids is associated with greater risk of all-cause, cancer, and cardiovascular mortality: a population-based cohort study in UK Biobank
Yuchen Zhang, Yitang Sun, Qi Yu, Suhang Song, J. Thomas Brenna, Ye Shen, Kaixiong Ye
medRxiv 2023.01.16.23284631; doi: https://doi.org/10.1101/2023.01.16.23284631
Risk for all three mortality outcomes increased as the ratio of omega-6/omega-3 PUFAs increased (all Ptrend < 0.05). Comparing the highest to the lowest quintiles, individuals had 26% (95% CI, 15-38%) higher total mortality, 14% (95% CI, 0-31%) higher cancer mortality, and 31% (95% CI, 10-55%) higher CVD mortality. Moreover, omega-3 and omega-6 PUFAs in plasma were all inversely associated with all-cause, cancer, and CVD mortality, with omega-3 showing stronger effects.

There are other studies that look at minerals in greater depth.
This one is on sodium/potassium intake and mortality. Turns out that the detrimental effects of sodium are vastly overblown:
Liu, D., Tian, Y., Wang, R. et al. Sodium, potassium intake, and all-cause mortality: confusion and new findings. BMC Public Health 24, 180 (2024). https://doi.org/10.1186/s12889-023-17582-8
Based on one or two 24-h dietary recalls, the sample consisted of 13,855 participants, representing a non-institutionalized population aged 40–80 years, totaling 11,348,771 person-months of mean follow-up 99.395 months. Daily sodium intake and daily potassium intake were inversely associated with all-cause mortality. Restrictive cubic spline analysis showed non-linear relationships between daily sodium intake, potassium intake, sodium–potassium ratio, and total mortality. The inflection point for daily sodium intake was 3133 mg/d, and the inflection point for daily potassium intake was 3501 mg/d, and the inflection point for daily sodium–potassium ratio intake was 1.203 mg/mg/d. In subgroup analyses, a significant interaction was found between age and high sodium intake, which was further confirmed by the smooth curves that showed a U-shaped relationship between sodium intake and all-cause mortality in the elderly population, with a inflection point of 3634 mg/d.

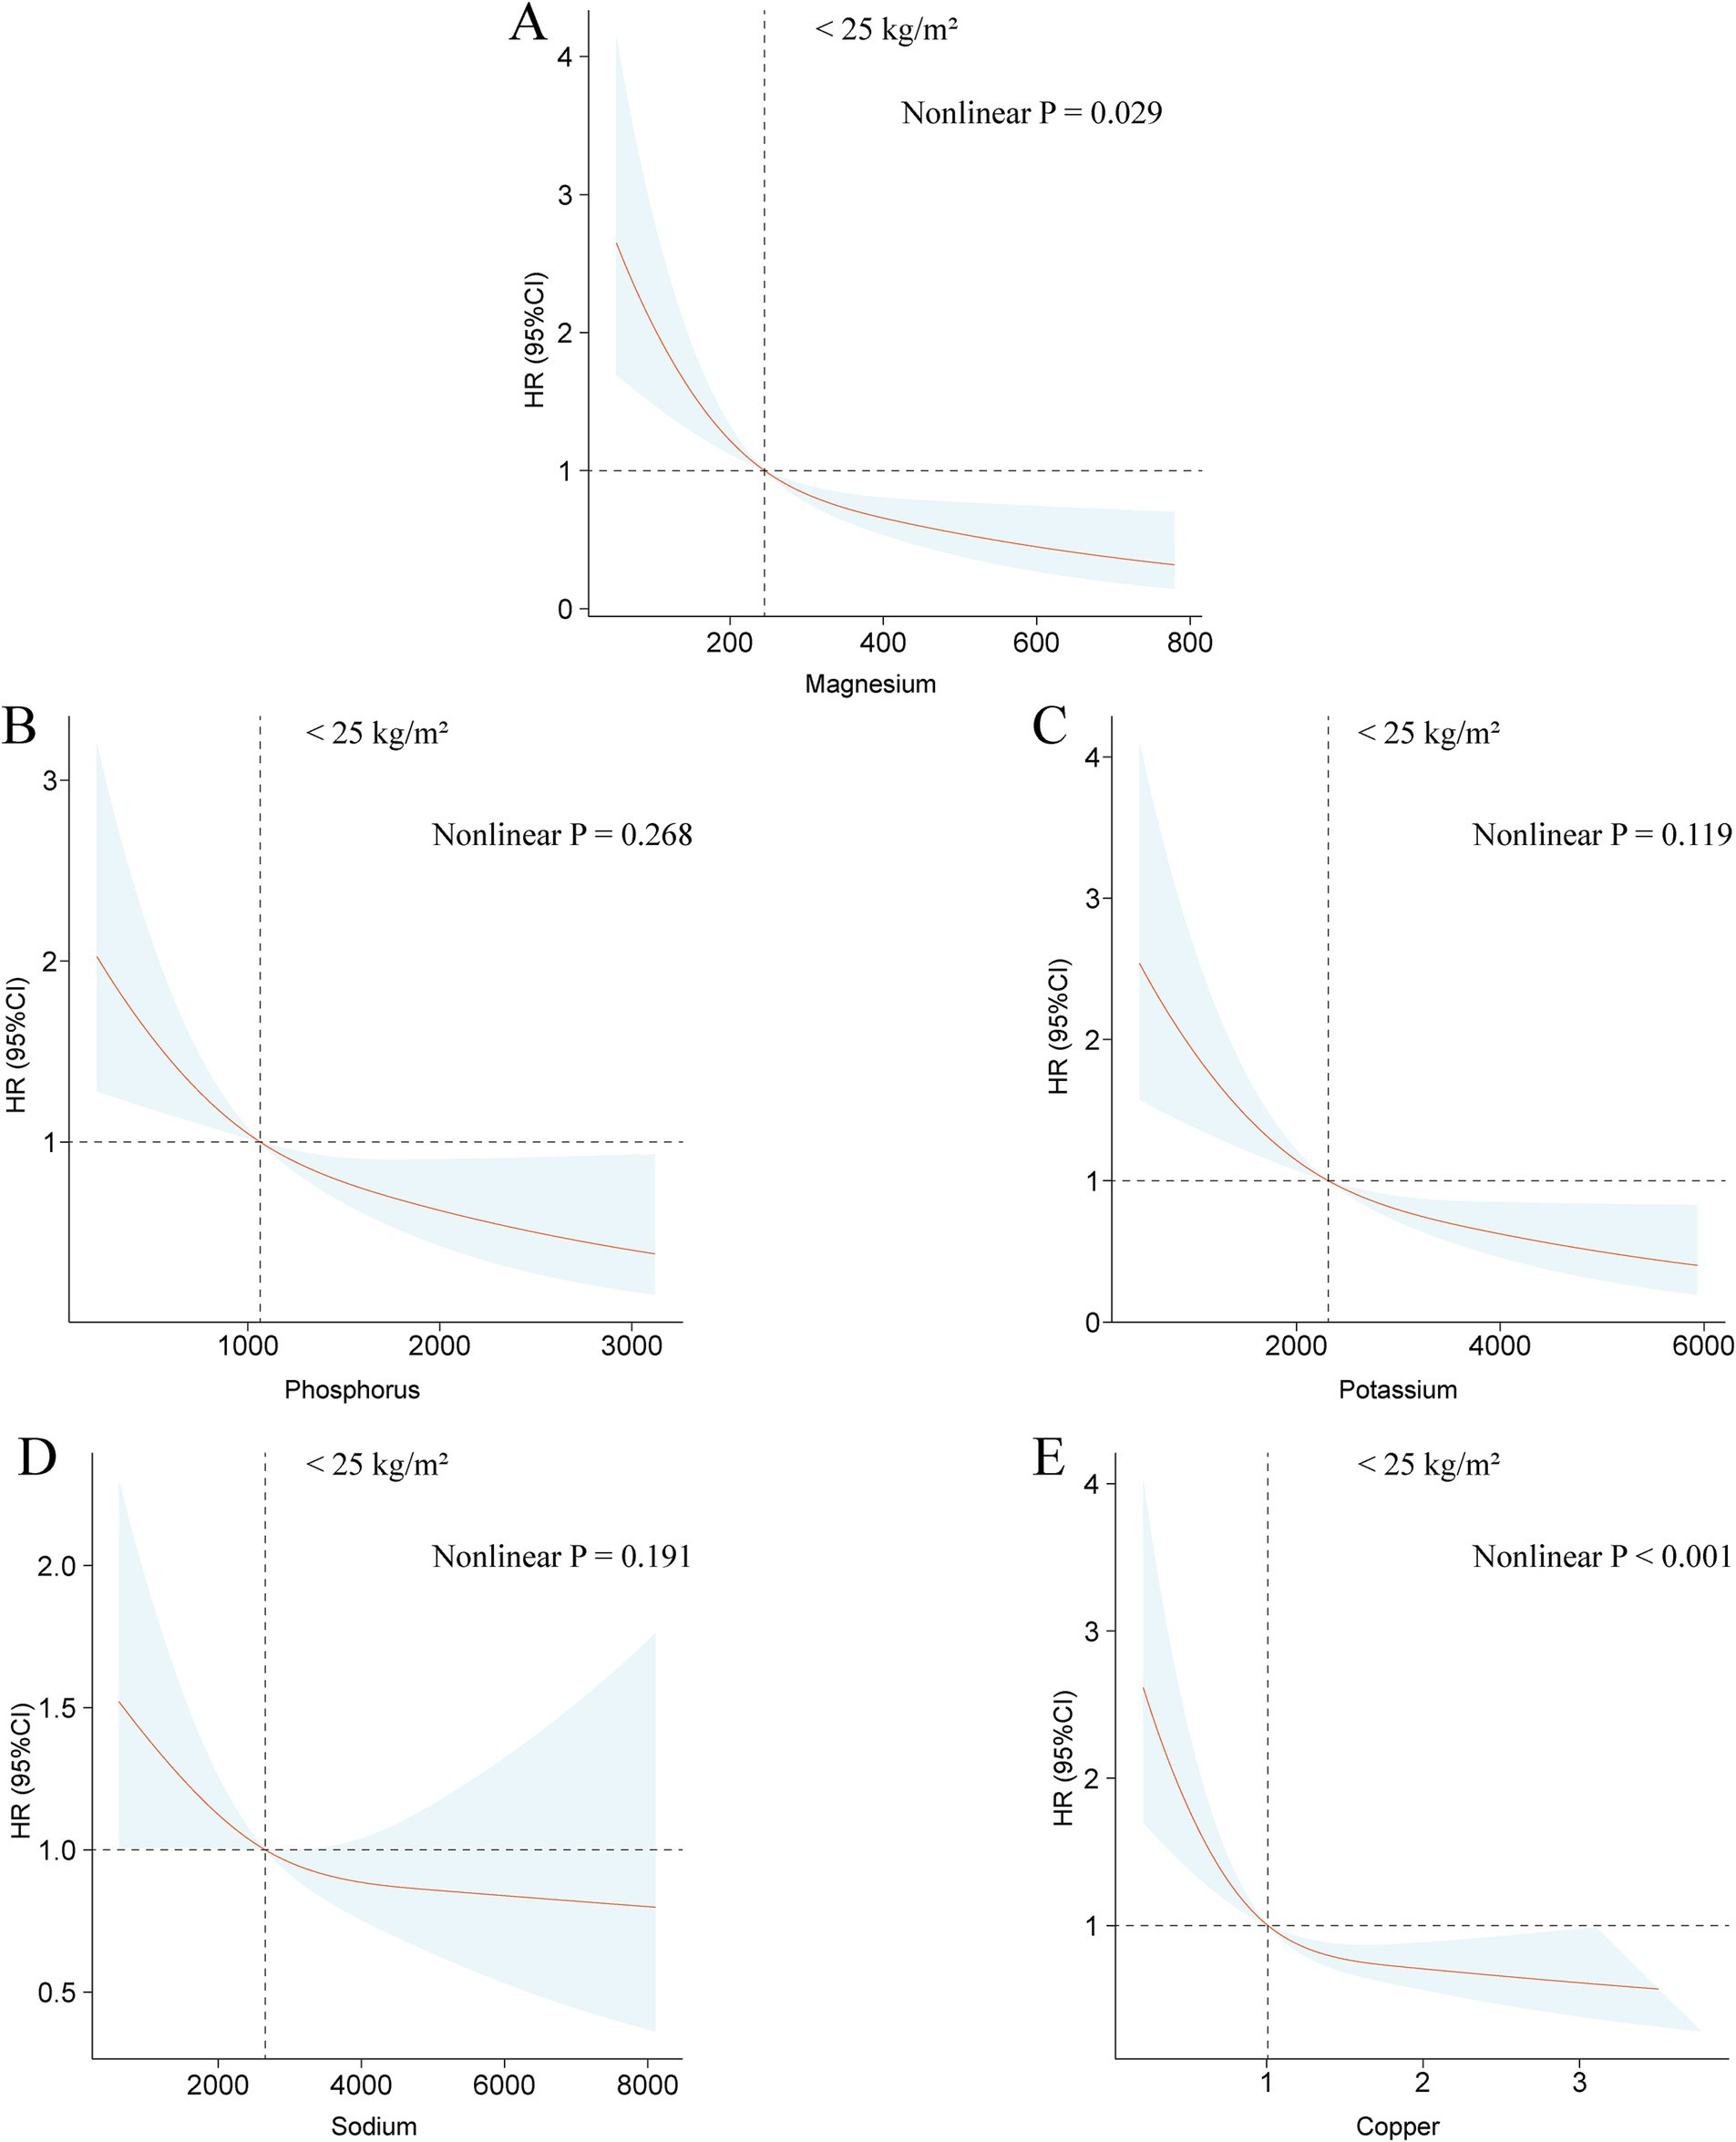
A similar study that looks at minerals in more detail within a population that had issues with plaque buildup in veins and arteries, confirming the results of the prior paper:
Duan C, Lv M, Shou X, Chen Z, Luan Y and Hu Y (2024) Associations between nine dietary minerals intake and all-cause mortality in individuals with atherosclerotic cardiovascular disease. Front. Nutr. 11:1447167. doi: 10.3389/fnut.2024.1447167
Over 6.25 years of median follow-up, 1,582 deaths were documented. Adjusted for potential covariates, results show a negative linear correlation between dietary magnesium intake and all-cause mortality (p for trend <0.001). Compared to the lowest quartile, all-cause mortality risk in the highest quartile was found to be 0.63 (95% CI 0.49–0.81). The associations between intake of the other eight dietary minerals and all-cause mortality were not robust. BMI significantly influenced the links between dietary minerals intake and all-cause mortality (p for interaction <0.05). Across BMI categories, significant negative associations were found between intake of magnesium, phosphorus, potassium, sodium, and copper and all-cause mortality in underweight or normal weight groups. In overweight individuals, intake of calcium, iron, magnesium, and potassium was negatively linked to all-cause mortality. For obese groups, sodium intake negatively affected all-cause mortality (p for trend <0.001).
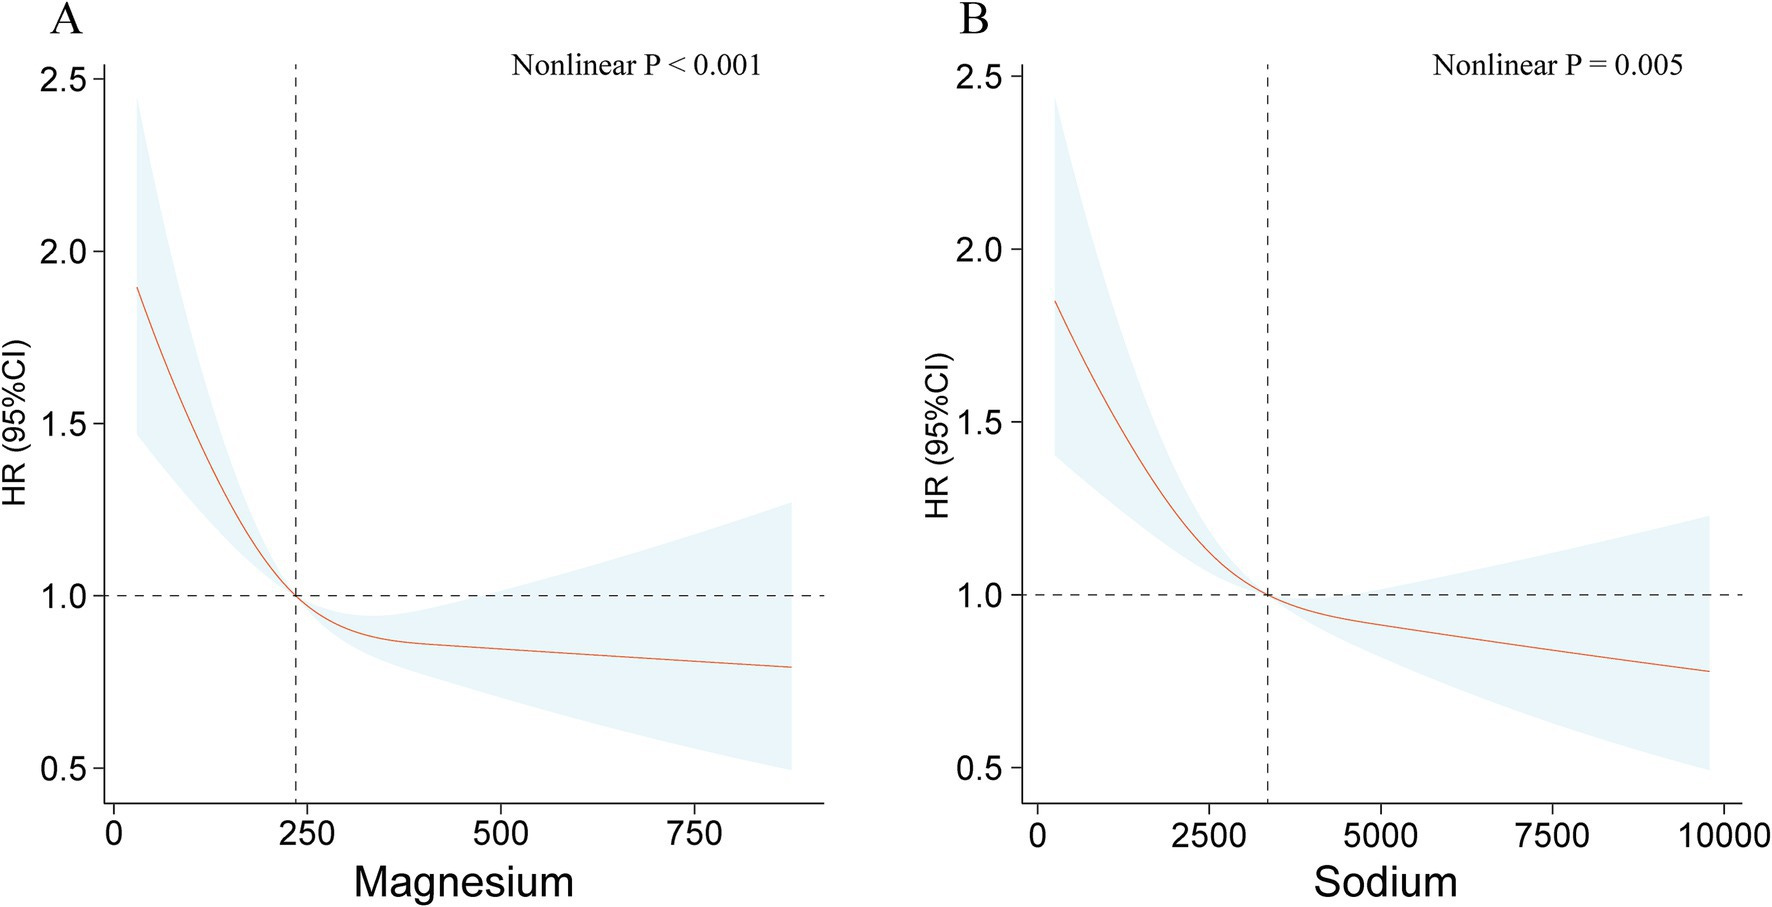
Before adjusting for BMI, they found non-linear U relationships between intake of most minerals and mortality (charts will be hard to see on phone):

But the effect reduced in most minerals after restricting the sample to thin people:

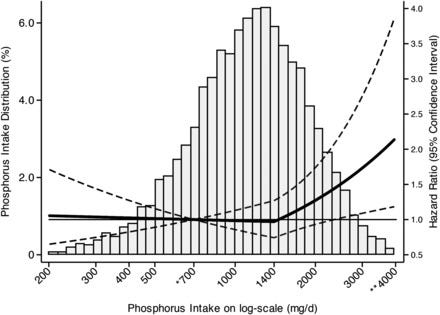
A smaller study finds a barely statistically significant effect of high phosphorus intake (past 1400mg) on all cause mortality. I’m inclined to mistrust it due to the wide confidence intervals of the nonlinear regression, but it was enough for me to roll back the recommendation a little bit.
Chang, A. R., Lazo, M., Appel, L. J., Gutiérrez, O. M., & Grams, M. E. (2013). High dietary phosphorus intake is associated with all-cause mortality: results from NHANES III. The American Journal of Clinical Nutrition, 99(2), 320–327. doi:10.3945/ajcn.113.073148
Median phosphorus intake was 1166 mg/d (IQR: 823–1610 mg/d); median phosphorus density was 0.58 mg/kcal (0.48–0.70 mg/kcal). Individuals who consumed more phosphorus-dense diets were older, were less often African American, and led healthier lifestyles (smoking, physical activity, and Healthy Eating Index). In analyses adjusted for demographics, cardiovascular risk factors, kidney function, and energy intake, higher phosphorus intake was associated with higher all-cause mortality in individuals who consumed >1400 mg/d [adjusted HR (95% CI): 2.23 (1.09, 4.5) per 1-unit increase in ln(phosphorus intake); P = 0.03]. At <1400 mg/d, there was no association. A similar association was seen between higher phosphorus density and all-cause mortality at a phosphorus density amount >0.35 mg/kcal [adjusted HR (95% CI): 2.27 (1.19, 4.33) per 0.1-mg/kcal increase in phosphorus density; P = 0.01]. At <0.35 mg/kcal (approximately the fifth percentile), lower phosphorus density was associated with increased mortality risk. Phosphorus density was associated with cardiovascular mortality [adjusted HR (95% CI): 3.39 (1.43, 8.02) per 0.1 mg/kcal at >0.35 mg/kcal; P = 0.01], whereas no association was shown in analyses with phosphorus intake. Results were similar by subgroups of diet quality and in analyses adjusted for sodium and saturated fat intakes.
Another study that finds a barely significant correlation between phosphorous intake and mortality:
Mendonça, L., Gonçalves, F., Sampaio, S. et al. Association between serum phosphorus and mortality in NHANES 2003–2006: the effect of gender and renal function. J Nephrol 35, 165–178 (2022). https://doi.org/10.1007/s40620-021-00969-4
A total of 590 deaths were recorded over a median follow-up of 81 months. Women showed higher serum phosphorus than men. The adjusted hazard ratio (HR) for all-cause mortality was 1.35 (95% CI 1.08–1.58) (p = 0.033) for the third tercile (versus second tercile). This increased risk was present in participants with estimated glomerular filtration rate (eGFR) below 90 ml/min/1.73 m2 but not above, although interaction was not significant (p = 0.12). Interaction by gender, phosphorus intake, PTH and fasting time was also not detected. For cardiovascular and cancer mortality, the adjusted HR was 0.81 (95% CI 0.33–2.00) (p = NS) and 1.45 (95% CI 0.77–2.72) (p = NS), respectively.

One on energy from carbohydrates and mortality:
Seidelmann, S.B., Claggett, B., Cheng, S., Henglin, M., Shah, A.M., Steffen, L.M., Folsom, A.R., Rimm, E.B., Willett, W.C., & Solomon, S.D. (2018). Dietary carbohydrate intake and mortality: a prospective cohort study and meta-analysis. The Lancet. Public health, 3, e419 - e428.
During a median follow-up of 25 years there were 6283 deaths in the ARIC cohort, and there were 40 181 deaths across all cohort studies. In the ARIC cohort, after multivariable adjustment, there was a U-shaped association between the percentage of energy consumed from carbohydrate (mean 48·9%, SD 9·4) and mortality: a percentage of 50–55% energy from carbohydrate was associated with the lowest risk of mortality. In the meta-analysis of all cohorts (432 179 participants), both low carbohydrate consumption (<40%) and high carbohydrate consumption (>70%) conferred greater mortality risk than did moderate intake, which was consistent with a U-shaped association (pooled hazard ratio 1·20, 95% CI 1·09–1·32 for low carbohydrate consumption; 1·23, 1·11–1·36 for high carbohydrate consumption). However, results varied by the source of macronutrients: mortality increased when carbohydrates were exchanged for animal-derived fat or protein (1·18, 1·08–1·29) and mortality decreased when the substitutions were plant-based (0·82, 0·78–0·87).

Without the other macronutrients this is fairly uninformative; it’s unclear if the issue is protein or fat. And what kind of protein and fat, for that matter.
On Vitamin E and mortality:
Qin H, Shen L, Xu D. Association of composite dietary antioxidant index with mortality in adults with hypertension: evidence from NHANES. Front Nutr. 2024 May 13;11:1371928. doi: 10.3389/fnut.2024.1371928. PMID: 38807639; PMCID: PMC11132182.
The analysis included 16,713 adults with hypertension (mean age 56.93 ± 0.23 years, 8,327 [49.61%] male). During the mean follow-up time 102.11 ± 1.22 months, with 3,908 (18.08%) all-cause mortality occurred, 1,082 (4.84%) cardiovascular mortality and 833 (3.80%) cancer mortality. Compared to the lowest quartile of CDAI, the weighted multivariate hazard ratios of participants in the highest quartile was 0.77 (95% CI, 0.68–0.87) for all-cause mortality, 0.83 (95% CI, 0.67–1.04) for cardiovascular mortality, and 0.64 (95% CI, 0.50–0.82) for cancer mortality. RCS analysis demonstrated a nonlinear association of CDAI with all-cause and cancer mortality, and a linear association between CDAI and cardiovascular mortality. The results were robust in subgroup analyses and sensitivity analyses.

Vitamin C and mortality:
Aune, D., Keum, N., Giovannucci, E., Fadnes, L. T., Boffetta, P., Greenwood, D. C., … Norat, T. (2018). Dietary intake and blood concentrations of antioxidants and the risk of cardiovascular disease, total cancer, and all-cause mortality: a systematic review and dose-response meta-analysis of prospective studies. The American Journal of Clinical Nutrition, 108(5), 1069–1091. doi:10.1093/ajcn/nqy097
Sixty-nine prospective studies (99 publications) were included. The summary RR per 100-mg/d increment of dietary vitamin C intake was 0.88 (95% CI: 0.79, 0.98, I 2 = 65%, n = 11) for coronary heart disease, 0.92 (95% CI: 0.87, 0.98, I 2 = 68%, n = 12) for stroke, 0.89 (95% CI: 0.85, 0.94, I 2 = 27%, n = 10) for cardiovascular disease, 0.93 (95% CI: 0.87, 0.99, I 2 = 46%, n = 8) for total cancer, and 0.89 (95% CI: 0.85, 0.94, I 2 = 80%, n = 14) for all-cause mortality. Corresponding RRs per 50-μmol/L increase in blood concentrations of vitamin C were 0.74 (95% CI: 0.65, 0.83, I 2 = 0%, n = 4), 0.70 (95% CI: 0.61, 0.81, I 2 = 0%, n = 4), 0.76 (95% CI: 0.65, 0.87, I 2 = 56%, n = 6), 0.74 (95% CI: 0.66, 0.82, I 2 = 0%, n = 5), and 0.72 (95% CI: 0.66, 0.79, I 2 = 0%, n = 8). Dietary intake and/or blood concentrations of carotenoids (total, βcarotene, α-carotene, β-cryptoxanthin, lycopene) and α-tocopherol, but not dietary vitamin E, were similarly inversely associated with coronary heart disease, stroke, cardiovascular disease, cancer, and/or all-cause mortality.

Vitamin K and mortality:
Palmer, C. R., Bellinge, J. W., Dalgaard, F., Sim, M., Murray, K., Connolly, E., Blekkenhorst, L. C., Bondonno, C. P., Croft, K. D., Gislason, G., Tjønneland, A., Overvad, K., Schultz, C., Lewis, J. R., Hodgson, J. M., & Bondonno, N. P. (2021). Association between vitamin K1 intake and mortality in the Danish Diet, Cancer, and Health cohort. European journal of epidemiology, 36(10), 1005–1014. https://doi.org/10.1007/s10654-021-00806-9
Reported associations between vitamin K1 and both all-cause and cause-specifc mortality are conficting. The 56,048 participants from the Danish Diet, Cancer, and Health prospective cohort study, with a median [IQR] age of 56 [52–60] years at entry and of whom 47.6% male, were followed for 23 years, with 14,083 reported deaths. Of these, 5015 deaths were CVD-related, and 6342 deaths were cancer-related. Intake of vitamin K1 (phylloquinone) was estimated from a foodfrequency questionnaire (FFQ), and its relationship with mortality outcomes was investigated using Cox proportional hazards models. A moderate to high (87–192 µg/d) intake of vitamin K1 was associated with a lower risk of all-cause [HR (95%CI) for quintile 5 vs quintile 1: 0.76 (0.72, 0.79)], cardiovascular disease (CVD)-related [quintile 5 vs quintile 1: 0.72 (0.66, 0.79)], and cancer-related mortality [quintile 5 vs quintile 1: 0.80 (0.75, 0.86)], after adjusting for demographic and lifestyle confounders. The association between vitamin K1 intake and cardiovascular disease-related mortality was present in all subpopulations (categorised according to sex, smoking status, diabetes status, and hypertension status), while the association with cancer-related mortality was only present in current/former smokers (p for interaction=0.002). These fndings suggest that promoting adequate intakes of foods rich in vitamin K1 may help to reduce all-cause, CVD-related, and cancer-related mortality at the population level.

Vitamin B1:
Wen H, Niu X, Zhao R, Wang Q, Sun N, Ma L, Li Y and Zhang W (2023) Association of vitamin B1 with cardiovascular diseases, all-cause and cardiovascular mortality in US adults. Front. Nutr. 10:1175961. doi: 10.3389/fnut.2023.1175961
The study enrolled 27,958 subjects (with a mean follow-up time of 9.11 years). After multivariate adjustment, dietary vitamin B1 intake was significantly associated with hypertension, heart failure and cardiovascular mortality, with the most significant association in quartile 4 (Q4) of vitamin B1 intake. The results of the restricted cubic spline showed that vitamin B1 intake was nonlinearly associated with hypertension, whereas it was linearly associated with heart failure and cardiovascular mortality. Meanwhile, a dose–response correlation was observed, indicating that increased vitamin B1 intake leads to reduced risk of both cardiovascular prevalence and mortality. The stratified analysis showed that the correlation between age ≥ 50 years, overweight, smoking history, drinking history and dyslipidemia were more significant in male patients. The associations remained similar in the sensitivity analyses.

Not a dietary study, but indicates there should be an upper limit of vitamin A intake.
Li H, Ye J, Dong Y, Kong W, Qian G and Xie Y (2024) U-shaped association of serum vitamin A concentrations with all-cause mortality in patients with NAFLD: results from the NHANES database prospective cohort study. Front. Nutr. 11:1467659. doi: 10.3389/fnut.2024.1467659
Over a median follow-up period of 10.3 years, a total of 1,399 all-cause deaths were recorded. The weighted average concentration of serum vitamin A was 61.48 ± 0.37 μg/dL. After adjusting for potential confounders, a significant U-shaped relationship was identified between serum vitamin A concentrations and the risk of all-cause mortality in NAFLD patients. This relationship was particularly pronounced in men and elderly individuals aged 60 to 85

Replication of the prior finding:
Huang, J., Weinstein, S.J., Yu, K. et al. Association between serum retinol and overall and cause-specific mortality in a 30-year prospective cohort study. Nat Commun 12, 6418 (2021). https://doi.org/10.1038/s41467-021-26639-4
How retinol as a clinical indicator of vitamin A status is related to long-term mortality is unknown. Here we report the results of a prospective analysis examining associations between serum retinol and risk of overall and cause-specific mortality. During a 30-year cohort follow-up, 23,797 deaths were identified among 29,104 men. Participants with higher serum retinol experienced significantly lower overall, CVD, heart disease, and respiratory disease mortality compared to men with the lowest retinol concentrations, reflecting 17–32% lower mortality risk (Ptrend < 0.0001). The retinol-overall mortality association is similar across subgroups of smoking intensity, alcohol consumption, body mass index, trial supplementation, serum alpha-tocopherol and beta-carotene concentrations, and follow-up time. Mediation analysis indicated that <3% of the effects of smoking duration and diabetes mellitus on mortality were mediated through retinol concentration. These findings indicate higher serum retinol is associated with lower overall mortality, including death from cardiovascular, heart, and respiratory diseases.

Unfortunately, there is no study that compares dietary retinol and all cause mortality, so I will have to infer the best dose from the serum levels. The optimal retinol serum level in the first study is about 70-75 ug/L, while in the second its about 65-70 ug/L — I’ll stick with 70 ug/L, which is about the 80th percentile, according to this study. On average, Americans consume about 500 ug of retinol a day, and the 80th percentile intake seems to be at about 750 ug. The mortality rate starts rising sharply a little before the average, so the absolute minimum was pegged at 500 ug.
Juanola-Falgarona, M., Salas-Salvadó, J., Martínez-González, M. Á., Corella, D., Estruch, R., Ros, E., … Bulló, M. (2014). Dietary Intake of Vitamin K Is Inversely Associated with Mortality Risk. The Journal of Nutrition, 144(5), 743–750. doi:10.3945/jn.113.187740
Vitamin K has been related to cardiovascular disease and cancer risk. However, data on total mortality are scarce. The aim of the present study was to assess the association between the dietary intake of different types of vitamin K and mortality in a Mediterranean population at high cardiovascular disease risk. A prospective cohort analysis was conducted in 7216 participants from the PREDIMED (Prevencion con Dieta ´ Mediterranea) study (median follow-up of 4.8 y). Energy and nutrient intakes were evaluated using a validated 137-item food frequency ´ questionnaire. Dietary vitamin K intake was calculated annually using the USDA food composition database and other published sources. Deaths were ascertained by an end-point adjudication committee unaware of the dietary habits of participants after they had reviewed medical records and linked up to the National Death Index. Cox proportional hazard models were fitted to assess the RR of mortality. Energy-adjusted baseline dietary phylloquinone intake was inversely associated with a significantly reduced risk of cancer and all-cause mortality after controlling for potential confounders (HR: 0.54; 95% CI: 0.30, 0.96; and HR: 0.64; 95% CI: 0.45, 0.90, respectively). In longitudinal assessments, individuals who increased their intake of phylloquinone or menaquinone during follow-up had a lower risk of cancer (HR: 0.64; 95% CI: 0.43, 0.95; and HR: 0.41; 95% CI: 0.26, 0.64, respectively) and all-cause mortality (HR: 0.57; 95% CI: 0.44, 0.73; and HR: 0.55; 95% CI: 0.42, 0.73, respectively) than individuals who decreased or did not change their intake. Also, individuals who increased their intake of dietary phylloquinone had a lower risk of cardiovascular mortality risk (HR: 0.52; 95% CI: 0.31, 0.86). However, no association between changes in menaquinone intake and cardiovascular mortality was observed (HR: 0.76; 95% CI: 0.44, 1.29). An increase in dietary intake of vitamin K is associated with a reduced risk of cardiovascular, cancer, or all-cause mortality in a Mediterranean population at high cardiovascular disease risk


Another serum study, but for manganese:
Ou, J., Sun, Y., Tong, J. et al. The relationship between serum manganese concentration with all-cause and cause-specific mortality: a retrospective and population-based cross-sectional study. BMC Cardiovasc Disord 24, 229 (2024). https://doi.org/10.1186/s12872-024-03872-5
In the full adjusted model, compared with the lowest quartile, the adjusted hazard ratios with 95% confidence intervals (CIs) for all-cause, CVD-related, and cancer-related mortality across manganese quartiles were (1.11 (0.87,1.41), 0.96 (0.74, 1.23), and 1.23 (0.96, 1.59); P-value for trend =0.041), (0.86 (0.54, 1.37), 0.87 (0.55, 1.40), and 1.07 (0.67, 1.72); P-value for trend =0.906), and (1.45 (0.92, 2.29), 1.14 (0.70, 1.88), and 1.26 (0.75, 2.11); P-value for trend =0.526), respectively. The RCS curve shown a U-shaped association between manganese concentration and all-cause mortality and CVD-related mortality (P-value for nonlinear <0.05). However, there was an increase and then a decrease in the link between manganese concentration and cancer-related mortality (P-value for nonlinear <0.05). Manganese exposure was positively correlated with sex (correlation coefficient, r =0.19, P-value <0.001) and negatively correlated with age (correlation coefficient, r =-0.11, P-value <0.001) and serum creatinine (correlation coefficient, r =-0.12, P-value <0.001), respectively.

Seems that the average is optimal, either due to the fact that the average causes better outcomes or better outcomes cause the average — probably a combination of both. There are no dietary manganese studies that I know of, so for now I will assume that the mean manganese intake is optimal, and anything below or above 1 SD is bad.
On average, people in Western countries consume about 2-3mg of manganese per day, which are low compared to diets in the past (8-10mg per day) due to changes in the foods people have consumed over time. I assume anything between that range is healthy, and the study I cited claims that the minimum intake should be 2mg per day to avoid deficiency:
In 1987, the author utilized the factorial approach to estimate Mn requirements in young men in the only study that utilized semi-purified diets to induce a Mn deficiency [26]. A Mn adequate diet (2.59 mg/day) was fed for 3 weeks to establish baseline data. Then a deficient diet (0.11 mg Mn/day) was fed for 39 days, followed by two 5-day periods of repletion (1.53 and 2.55 mg Mn/day). During the period of minimal intake, endogenous losses averaged 0.11 mg/day; calculations estimated the Mn requirements to be 0.74 mg/day [26]. Since this experiment diet was free of inhibitory components such as phytates, fibers and other competing trace elements, the authors proposed that the Mn intake to be increased to 2.11 mg/when consuming a typical mixed diet of whole foods [26].
Iodine:
Abel, M.H., Caspersen, I.H., Sengpiel, V. et al. Insufficient maternal iodine intake is associated with subfecundity, reduced foetal growth, and adverse pregnancy outcomes in the Norwegian Mother, Father and Child Cohort Study. BMC Med 18, 211 (2020). https://doi.org/10.1186/s12916-020-01676-w
The median iodine intake from food was 121 μg/day and the median urinary iodine was 69 μg/L, confirming mild-to-moderate iodine deficiency. In non-users of iodine supplements (n = 49,187), low iodine intake (< 100–150 μg/day) was associated with increased risk of preeclampsia (aOR = 1.14 (95% CI 1.08, 1.22) at 75 vs. 100 μg/day, p overall < 0.001), preterm delivery before gestational week 37 (aOR = 1.10 (1.04, 1.16) at 75 vs. 100 μg/day, p overall = 0.003), and reduced foetal growth (− 0.08 SD (− 0.10, − 0.06) difference in birth weight z-score at 75 vs. 150 μg/day, p overall < 0.001), but not with early preterm delivery or intrauterine death. In planned pregnancies (n = 56,416), having an iodine intake lower than ~ 100 μg/day was associated with increased prevalence of subfecundity (aOR = 1.05 (1.01, 1.09) at 75 μg/day vs. 100 μg/day, p overall = 0.005). Long-term iodine supplement use (initiated before pregnancy) was associated with increased foetal growth (+ 0.05 SD (0.03, 0.07) on birth weight z-score, p < 0.001) and reduced risk of preeclampsia (aOR 0.85 (0.74, 0.98), p = 0.022), but not with the other adverse pregnancy outcomes. Urinary iodine concentration was not associated with any of the dichotomous outcomes, but positively associated with foetal growth (n = 2795, p overall = 0.017).


The optimal dose for Norweigan mothers appears to be 120ug. Adjusting upwards towards a “global human” who eats 2200 calories a day would imply an optimal level of 150ug or so.
There are no studies on dietary chloride, but I noted that organizations set the average recommended chloride intake to whatever the recommended salt intake is, so I will follow their example.
I found one article that claims that people should not supplement with over 250mg of B3 due to the fact that it is associated with higher mortality and heart disease risk — I didn’t look too closely at the studies he cited, but I find it credible.
He also cited a study on B3 intake and all-cause mortality in patients with kidney disease:
Zhou Z and Yao X (2024) Dietary niacin intake and mortality among chronic kidney disease patients. Front. Nutr. 11:1435297. doi: 10.3389/fnut.2024.1435297
The median niacin intake was 20.89 mg/day, with an interquartile range of 15.67–27.99 mg/day. During the follow-up period (median of 87 months), there were 1,984 all-cause deaths, including 714 CVD deaths. Compared with low niacin intake, the multivariate-adjusted hazard ratio for dietary intake of 22 mg or higher was 0.71 (95% CI, 0.57–0.88) for all-cause mortality and 0.75 (95% CI, 0.57, 0.98) for CVD mortality.

Effect for all cause mortality seems to attenuate around 20mg, severely at around 40mg.
Another on the same topic:
Yang, R., Zhu, M., Fan, S. et al. Niacin intake and mortality (total and cardiovascular disease) in patients with cardiovascular disease: Insights from NHANES 2003–2018. Nutr J 23, 123 (2024). https://doi.org/10.1186/s12937-024-01027-y
After adjustment for multiple covariates, HRs and 95% CIs in model 3 indicated that participants in the highest quartile (Quartile 4) of dietary niacin intake were at lower risk for all-cause mortality (HR = 0.74, 95% CI: 0.60–0.90, P for trend = 0.010) and CVD mortality (HR = 0.67, 95% CI:0.51–0.89, P for trend = 0.020).

Not significant, but the effect is in the same direction as the previous one, and the diminishing returns appear earlier.
A third study:
Fu, Y., Xu, C. & Wu, G. Dietary niacin Intake and its association with all-cause and cardiovascular mortality rates in individuals with metabolic syndrome. Nutr J 23, 90 (2024). https://doi.org/10.1186/s12937-024-00993-7
This cohort study included 8,744 participants, and during a median follow-up period of 106 months, 1,552 (17.7%) deaths were recorded, with 511 attributed to cardiovascular disease. Kaplan-Meier curves comparing quartiles of dietary niacin intake showed significant differences in both all-cause and cardiovascular mortality rates (log-rank p < 0.001). In the fully adjusted model, the highest quartile of dietary niacin intake was associated with HRs of 0.68 (95% CI: 0.54, 0.87, P = 0.002) for all-cause mortality and 0.63 (95% CI: 0.39, 0.78, P < 0.001) for cardiovascular mortality.

Same results, but statistically significant this time. It seems that there does not seem to be any diminishing returns to more niacin, but I feel somewhat reticent to set a high recommended dose just based on these three studies, especially given that most regulatory agencies set a max dose of about 35mg. For now, I’ll set the minimum recommended dose to 20mg and the ideal one to 50mg.
Those will be the minimum and recommended doses, respectively.
For folate, B6, and B12, I found this study:
Bo, Y., Xu, H., Zhang, H., Zhang, J., Wan, Z., Zhao, X., & Yu, Z. (2022). Intakes of Folate, Vitamin B6, and Vitamin B12 in Relation to All-Cause and Cause-Specific Mortality: A National Population-Based Cohort. Nutrients, 14(11), 2253. https://doi.org/10.3390/nu14112253
The evidence regarding the intake of dietary folate, vitamin B6, and vitamin B12 in relation to mortality in the general population is limited. This study aimed to examine the relationship between dietary intakes of folate, vitamin B6, and vitamin B12 in relation to all-cause and cause-specific mortality in a large U.S. cohort. This study included a total of 55,569 adults from the Third National Health and Nutrition Examination Survey (NHANES III) and NHANES 1999–2014. Vital data were determined by linking with the National Death Index records through 31 December 2015. Cox proportional hazards models were used to investigate the relationships of all-cause and cause-specific mortality with dietary folate, vitamin B6, and vitamin B12 intake. Dietary intakes of folate and vitamin B6 were inversely associated with mortality from all-cause, cardiovascular disease, and cancer for men and with mortality from all-cause and cardiovascular disease for women. In men, the multivariable hazard ratios (95% confidence intervals) for the highest versus lowest quintiles of folate and vitamin B6 were 0.77 (0.71–0.85) and 0.79 (0.71–0.86) for all-cause mortality, 0.59 (0.48–0.72) and 0.69 (0.56–0.85) for CVD mortality, and 0.68 (0.56–0.84) and 0.73 (0.60–0.90) for cancer mortality, respectively. Among women, the multivariable hazard ratios (95% confidence intervals) for the highest versus lowest quintiles of folate and vitamin B6 were 0.86 (0.78–0.95) and 0.88 (0.80–0.97) for all-cause mortality and 0.53 (0.41–0.69) and 0.56 (0.44–0.73) for CVD mortality, respectively. No significant associations between dietary vitamin B12 and all-cause and cause-specific mortality were observed. In conclusion, higher dietary intakes of folate and vitamin B6 were significantly associated with lower all-cause and cardiovascular mortality. Our findings suggest that increasing the intake of folate and vitamin B6 may lower the mortality risk among U.S. adults.


I was also able to find a Japanese study with roughly the same exact results.
For B6 and Folate, I’ll peg the minimum recommended intake at Q3 and the recommended intake at Q4. According to this image I found on the internet, Q3 for B6 is about 2mg and Q4 is at about 2.3mg'; Q3 for folate is at about 350 ug and Q4 is at 430 ug.

I wanted to find more information on B12 before jumping to any conclusions:
Xu, K., Liu, X., Liu, J. et al. Association between serum vitamin B12 and risk of all-cause mortality in elderly adults: a prospective cohort study. BMC Geriatr 21, 497 (2021). https://doi.org/10.1186/s12877-021-02443-z
Among 2,086 participants [mean ± SD: 87.74 ± 11.24 years, 908 (43.53 %) males], 943 (45.21 %) died during an average follow-up of 3.34 (SD: 1.63) years. Comparing with participants with middle concentration of serum vitamin B12, participants with high concentration had an increased risk of all-cause mortality [HR (95 %CIs): 1.30 (1.03–1.64)], whereas participants with low concentration had an insignificantly decreased risk of all-cause mortality (0.96, 0.76–1.20). The positive association between high concentration of serum vitamin B12 and all-cause mortality was also observed among the male and in a series of sensitivity analyses. In the dose-response analysis, a J-shape pattern was observed, but the non-linear association was only significant in males (Pnon−linearity = 0.0351).

Nothingburger tier results.
A meta-analysis of serum B12 levels and mortality:
Liu, Kefeng & Yang, Zhirong & Lu, Xiaojing & Zheng, Bang & Wu, Shanshan & Kang, Jian & Sun, Shusen & Zhao, Jie. (2023). The origin of vitamin B12 levels and risk of all-cause, cardiovascular and cancer specific mortality: A systematic review and dose-response meta-analysis. Archives of Gerontology and Geriatrics. 117. 105230. 10.1016/j.archger.2023.105230.
Twenty-two cohort studies (92,346 individuals with 10,704 all-cause deaths) were included. A linear trend dose-response analysis showed that each 100 pmol/L increase in serum vitamin B12 concentration was associated with a 4 % higher risk of all-cause mortality in the general population (adjusted HR 1.04, 95 % confidence interval CI 1.01 to 1.08; n = 8; P non-linearity = 0.11) and a 6 % higher risk for all-cause mortality in older adults (adjusted HR 1.06, 95 % CI 1.01 to 1.13; n = 4; P non-linearity = 0.78). Current evidence was mixed for the association between serum vitamin B12 concentration and cardiovascular mortality and was limited for cancer mortality. The meta-analysis of cohort studies showed a positive association between a high serum vitamin B12 concentration (>600 pmol/L) and all-cause mortality (adjusted HR 1.50, 95 % CI 1.29 to 1.74; n = 10; p < 0.01), CVD mortality (adjusted HR 2.04, 95 % CI 0.99 to 4.19; n = 2; p = 0.02), except cancer mortality (adjusted HR 1.56, 95 % CI 0.82 to 2.95; n = 3). Similarly, serum vitamin B12 concentrations (400–600 pmol/L) were associated with increased all-cause mortality (adjusted HR 1.34, 95 % CI 1.10 to 1.64; n = 9; p < 0.01).
Higher serum levels are associated with mortality, which I suspect is largely due to confounding in diet; I doubt B12 actually kills people. Due to the inconclusive nature of the results, I will simply use the US RDA as the minimum dose and the average intake as the recommended dose.
I was unable to find any good studies on B2 and B5, so I set the minimum dose to the US RDA and the recommended dose to slightly above that for both.
Choline
Choline-deficient food intake seems to be a decent candidate for a cause of obesity:
Gao, Xiang & Wang, Yongbo & Randell, Edward & Pedram, Pardis & Yi, Yanqing & Gulliver, Wayne & Sun, Guang. (2016). Higher Dietary Choline and Betaine Intakes Are Associated with Better Body Composition in the Adult Population of Newfoundland, Canada. PloS one. 11. e0155403. 10.1371/journal.pone.0155403.
Significantly inverse correlations were found between dietary choline and betaine intakes, with all obesity measurements: total percent body fat (%BF), percent trunk fat (%TF), per-cent android fat (%AF), percent gynoid fat (%GF) and anthropometrics: weight, body mass index, waist circumference, waist-to-hip ratio in both women and men (r range from -0.13 to -0.47 for choline and -0.09 to -0.26 for betaine, p<0.001 for all). Dietary choline intake had stronger association than betaine. Moreover, obese subjects had the lowest dietary choline and betaine intakes, with overweight subjects in the middle, and normal weight subjects consumed the highest dietary choline and betaine (p<0.001). Vice versa, when subjects were ranked according to dietary choline and betaine intakes, subjects with the highest intake of both had the lowest %TF, %AF, %GF, %BF and highest %LM among the groups in both sexes.

Replication finds that choline intake protects against CVD through this mechanism:
Despite extensive research on the relationship between choline and cardiovascular disease (CVD), conflicting findings have been reported. We aim to investigate the relationship between choline and CVD. Our analysis screened a retrospective cohort study of 14,663 participants from the National Health and Nutrition Examination Survey conducted between 2013 and 2018. Propensity score matching and restricted cubic splines was used to access the association between choline intake and the risk of CVD. A two-sample Mendelian randomization (MR) analysis was conducted to examine the potential causality. Additionally, sets of single cell RNA-sequencing data were extracted and analyzed, in order to explore the role of choline metabolism pathway in the progression and severity of the CVD and the underlying potential mechanisms involved. The adjusted odds ratios and 95% confidence intervals for stroke were 0.72 (0.53–0.98; p = 0.035) for quartile 3 and 0.54 (0.39–0.75; p < 0.001) for quartile 4. A stratified analysis revealed that the relationship between choline intake and stroke varied among different body mass index and waist circumference groups. The results of MR analysis showed that choline and phosphatidylcholine had a predominantly negative causal effect on fat percentage, fat mass, and fat-free mass, while glycine had opposite effects. Results from bioinformatics analysis revealed that alterations in the choline metabolism pathway following stroke may be associated with the prognosis. Our study indicated that the consumption of an appropriate quantity of choline in the diet may help to protect against CVD and the effect may be choline-mediated, resulting in a healthier body composition. Furthermore, the regulation of the choline metabolism pathway following stroke may be a promising therapeutic target.


A study on choline intake and all cause mortality. Fairly weak association, but at least hits stat sig.
Jieru, Peng & Zhang, Shanshan & Cai, Lin & Long, Wencheng & Wang, Yueshan & Zhang, Lu & Dong, Yao & Zhang, Wenqi & Liao, Juan & Yang, Chunxia. (2024). Dietary choline intake and health outcomes in U.S. adults: exploring the impact on cardiovascular disease, cancer prevalence, and all-cause mortality. Journal of Health, Population and Nutrition. 43. 10.1186/s41043-024-00528-0.
Background Choline, an indispensable nutrient, plays a pivotal role in various physiological processes. The available evidence regarding the nexus between dietary choline intake and health outcomes, encompassing cardiovascular disease (CVD), cancer, and all-cause mortality, is limited and inconclusive. This study aimed to comprehensively explore the relationship between dietary choline intake and the aforementioned health outcomes in adults aged > 20 years in the U.S. Methods This study utilized data from the National Health and Nutrition Examination Survey between 2011 and 2018. Dietary choline intake was evaluated using two 24-h dietary recall interviews. CVD and cancer status were determined through a combination of standardized medical status questionnaires and self-reported physician diagnoses. Mortality data were gathered from publicly available longitudinal Medicare and mortality records. The study utilized survey-weighted logistic and Cox regression analyses to explore the associations between choline consumption and health outcomes. Restricted cubic spline (RCS) analysis was used for dose‒response estimation and for testing for nonlinear associations. Results In our study of 14,289 participants (mean age 48.08 years, 47.71% male), compared with those in the lowest quintile (Q1), the adjusted odds ratios (ORs) of CVD risk in the fourth (Q4) and fifth (Q5) quintiles of choline intake were 0.70 (95% CI 0.52, 0.95) and 0.65 (95% CI 0.47, 0.90), respectively (p for trend = 0.017). Each 100 mg increase in choline intake was associated with a 9% reduced risk of CVD. RCS analysis revealed a linear correlation between choline intake and CVD risk. Moderate choline intake (Q3) was associated with a reduced risk of mortality, with an HR of 0.75 (95% CI 0.60–0.94) compared with Q1. RCS analysis demonstrated a significant nonlinear association between choline intake and all-cause mortality (P for nonlinearity = 0.025). The overall cancer prevalence association was nonsignificant, except for colon cancer, where each 100 mg increase in choline intake indicated a 23% reduced risk. Conclusion Elevated choline intake demonstrates an inverse association with CVD and colon cancer, while moderate consumption exhibits a correlated reduction in mortality. Additional comprehensive investigations are warranted to elucidate the broader health implications of choline.

Might even protect against depression.
Jingxian Li, Xiao Kang, Liming Zhang, Jia Luo, Dongfeng Zhang,
Dietary choline is inversely associated with depressive symptoms: A cross-sectional study of the National Health and Nutrition Examination Survey (NHANES) 2011 to 2018,Journal of Affective Disorders,Volume 301,2022,Pages 23-29,ISSN 0165-0327,https://doi.org/10.1016/j.jad.2022.01.013.
In three models, compared with the bottom quintile, each quintile of dietary choline was significantly associated with a lower risk of depressive symptoms. After adjusted all selected confounding factors and covariates, the odds ratio with the 95% confidence interval of depressive symptoms was 0.57 (95% CI:0.38–0.85) for the highest quintile versus the lowest quintile of dietary choline intake. Statistical significance was also maintained in gender and age stratification studies. In the study of the dose-response relationship, an L-shaped relationship between dietary choline and depressive symptoms was found.
 2011 to 2018 - ScienceDirect")
A study that, puzzlingly enough, finds that choline intake is associated with increased mortality and obesity within all races:
Jae Jeong Yang, Loren P Lipworth, Xiao-Ou Shu, William J Blot, Yong-Bing Xiang, Mark D Steinwandel, Honglan Li, Yu-Tang Gao, Wei Zheng, Danxia Yu,
Associations of choline-related nutrients with cardiometabolic and all-cause mortality: results from 3 prospective cohort studies of blacks, whites, and Chinese,The American Journal of Clinical Nutrition,Volume 111, Issue 3,2020,Pages 644-656,ISSN 0002-9165,https://doi.org/10.1093/ajcn/nqz318.
Mean choline intake among blacks, whites, and Chinese was 404.1 mg/d, 362.0 mg/d, and 296.8 mg/d, respectively. During a median follow-up of 11.7 y, 28,673 deaths were identified, including 11,141 cardiometabolic deaths. After comprehensive adjustments, including for overall diet quality and disease history, total choline intake was associated with increased cardiometabolic mortality among blacks and Chinese (HR for highest compared with lowest quintile: 1.26; 95% CI: 1.13, 1.40 and HR: 1.23; 95% CI: 1.11, 1.38, respectively; both P-trend < 0.001); among whites, the association was weaker (HR: 1.12; 95% CI: 0.95, 1.33; P-trend = 0.02). Total choline intake was also associated with diabetes and all-cause mortality in blacks (HR: 1.66; 95% CI: 1.26, 2.19 and HR: 1.20; 95% CI: 1.12, 1.29, respectively), with diabetes mortality in Chinese (HR: 2.24; 95% CI: 1.68, 2.97), and with IHD mortality in whites (HR: 1.31; 95% CI: 1.02, 1.69) (all P-trend < 0.001). The choline–mortality association was modified by alcohol consumption and appeared stronger among individuals with existing cardiometabolic disease. Betaine intake was associated with increased cardiometabolic mortality in Chinese only (HR: 1.16; 95% CI: 1.08, 1.25; P-trend < 0.001).
No idea why this is the case. Perhaps the coding method resulted in choline intake being more correlated with eating animal products, or perhaps this study made a coding mistake. Unclear.
Upper limits
For most of the conventional fat-soluble vitamins as well as folate, I’m inclined to just trust the authorities. However, the recommended upper limit for vitamin D is not based on evidence, and the ideal dose of vitamin D is probably about 5k IU to 50k IU (I also used the linked article as the source for the vitamin D optimal dose).
Some sources I used to make the upper limits:
Changelog
v2: change niacin optimal dose to 30mg as it is unlikely that constantly dilating your blood vessels until they make your skin burn is probably not a good thing. Altho
v3 changed niacin dose confidence from high to medium due to the fact it is unclear if niacin flushing is a benign side effect. Removed saturated fat dose altogether, as it was misleading and did not correspond with my own take on the subject, which was that they are probably less healthy than monounsaturated fats, but that they are overly maligned and evidence is not as supportive of them being killers as is commonly thought.
Hi Sebastian,
Thanks very much for this extensive review of nutrients! I will return to it as time allows.
Potassium is a very much neglected nutrient, but the most critical need most people have for supplementation is vitamin D3.
The whole concept of an RDA is flawed in many ways - primarily due to the variations in body weight by age, between individuals, and between races. In in the case of vitamin D3, it is doubly flawed since, in order to attain a healthy level of 25-hydroxyvitamin D - 50 ng/mL (125 nmol/L = 1 part in 20,000,000 by mass) or more (see below) we need to scale daily supplemental intake not just according to body weight, but to use higher ratios for those suffering from obesity. This is because obesity reduces the rate of hydroxylation in the liver and because the resultant 25-hydroxyvitamin D (and probably vitamin D3 itself) is sequestered in the excess adipose tissue. See the research cited and discussed at: https://5nn.info/temp/250hd-obesity/.
Please see the research cited and discussed regarding the vitamin D compounds and the immune system, at: https:// vitamindstopscovid.info/00-evi/.
This begins with recommendations from New Jersey based Professor of Medicine, Sunil Wimalawansa on the average daily supplemental intake quantities of vitamin D3 which will attain least 50 ng/mL circulating 25-hydroxyvitamin D, over several months, without the need for blood tests or medical monitoring:
70 to 90 IU / kg body weight for those not suffering from obesity (BMI < 30).
100 to 130 IU / kg body weight for obesity I & II (BMI 30 to 39).
140 to 180 IU / kg body weight for obesity III (BMI > 39).
For 70 kg (154 lb) body weight without obesity, this is about 0.125 milligrams (125 micrograms 5000 IU) a day. This takes several months to attain the desired > 50 ng/mL circulating 25-hydroxyvitamin D. This is 8 or more times what most governments recommend. "5000 IU" a day sounds like a lot, but it is a gram every 22 years - and pharma-grade vitamin D costs about USD$2.50 a gram ex-factory.
These recommendations are included in a recent article with another professor of medicine Scott T. Weiss and professor of pediatrics Bruce W. Hollis: https:// www.mdpi.com/2072-6643/16/22/3969. All three have been researching vitamin D for decades.
The article on hospital supplementation of vitamin D3 is by Patrick McCullough et al.: "Daily oral dosing of vitamin D3 using 5000 TO 50,000 international units a day in long-term hospitalized patients: Insights from a seven year experience" Journal of Steroid Biochemistry and Molecular Biology 2019-01-04 https://www.sciencedirect.com/science/article/abs/pii/S0960076018306228 (Paywalled.) PDF: https://sci-hub.se/10.1016/j.jsbmb.2018.12.010.
The 1.25 mg 50,000 IU/day vitamin D3 supplemental intake is for Dr McCullough himself - to suppress psoriasis. This McCullough protocol is much the same as the better known (Cicero) Coimbra protocol and the lesser known (since it is by a chemist and ex US Navy fighter pilot) protocol by Pete Batcheller, which has suppressed cluster headaches and migraines for thousands of sufferers. Please see the research cited and discussed at: https://vitamindstopscovid.info/06-adv/.
Hypercalcemia involves drawing calcium out of the bones, to boost the level of calcium ions in the blood, which must be maintained near saturation level, within unusually narrow limits. The Coimbra etc. protocols all involve avoiding calcium supplementation and calcium rich foods. Vitamin K7 is widely regarded as helping reduce excessive calcium levels and retaining it in the bone. I am yet to do a proper survey of vitamin K2 research. I am keen to find what guidance there may be, or which can be reasonably ascertained from research, regarding vitamin K2 quantities and to what extent the MK4 and MK7 forms should be used.
Like most doctors (immunologists have no clue about or interest in the vitamin D compounds) and far too many vitamin D researchers, the author of the long piece on X: https://x.com/vers_laLune/status/1846273267658559878, does not understand that the immune system is not significantly affected by the very low (0.05 to 0.1 ng/mL) level of circulating, hormonal, calcitriol (1,25-dihydroxyvitamin D) which the kidneys maintain as part of a larger feedback network involving osteocytes and the parathyroid gland, to regulate calcium-phosphate-bone metabolism.
Many types of immune cell require a good supply, by diffusion from the bloodstream, of 25-hydroxyvitamin D, made primarily in the liver from ingested of UV-B -> skin produced vitamin D3 cholecalciferol. They use this as a raw material to run their intracrine (inside each cell) and paracrine (to nearby cells, typically of different types, signaling systems.
These are unrelated to hormonal (endocrine) signaling. Since, as far as I know, there are no tutorial explanations of these, I wrote a non-peer reviewed tutorial in late 2020: https://vitamindstopscovid.info/02-intracrine/.
A less detailed tutorial is at the start of: https://vitamindstopscovid.info/00-evi/. Every doctor, nurse, immunologist, vaccinologist, virologist etc. needs to understand these signaling systems - but most have never heard of them.
The link you have for the Lancet article with the six mortality vs. 25-hydroxyvitamin D graphs does not work. The URL is: https://www.thelancet.com/journals/landia/article/PIIS2213-8587(23)00287-5/fulltext.
Boron is an extremly neglected nutrient. It is important for immune system response and bone metabolism. Most people get about 1mg a day or so in their diet, but 6 to 9 mg a day for average weight adults is healthier, as far as I can tell. No-one knows exactly what it does. It goes in and out of the body in a day or so and is not known to form any compounds. My best guess - and that of researchers as far as I know - is that the borate ion subtly affects many biochemical reactions.
My notes on boron nutrition contains links to the best research I could find in 2020: https://aminotheory.com/cv19/#08-boron. I am not aware of any great advances since then. Please let me know if you find any.
You - and anyone who seriously appreciates what you wrote (even if they don't yet fully understand it all) - are cordially invited to join the Nutrition for Immune System Health email discussion group: https://nish.groups.io. Members include several leading vitamin D researchers, and vitamin D is by far the most discussed nutrient. Magnesium is probably second. See the work of Patrick Chambers MD: https://www.researchgate.net/profile/Patrick-Chambers-4/research.
That's a long essay, I'll read it later