Data
I have collected 3941 IQ scores and attempts on scholastic tests (e.g. PISA, PIRLS) across the globe using Becker’s national IQ dataset and the harmonized learning otucomes dataset. Performance on tests was graded relative to the countries that participated in them, so if an organization coincidentally sampled a wave of highly intelligent countries, scores on that test would be increased accordingly. There have been several other attempts to do this (e.g. harmonized learning outcomes, basic skills dataset), though I think my data is better, as the inclusion of the IQ scores allow for more precise linkage between sources. For example, the basic skills dataset links performance on several international tests based on only a few countries, and in two cases, just one.
Because national IQs cover so many countries, and in so many regions, doing these scale transformations is much easier and more precise. If there was a regional North African cognitive test assessment that was normalized at a mean of 500 and standard deviation of 100, performance on that test would have to be scaled, as North Africans perform worse than Europeans on tests. If Morocco were to be used as an anchor, the penalization could potentially range from 40 to 15 IQ points if only one sample was considered:
The scores on the IQ tests are adjusted for the Flynn Effect and normed to the UK mean and standard deviation, as Flynn Effects generally don’t pass measurement invariance, and are not on g. The performance on the scholastic tests is not adjusted for changes across time - I tried testing for a false Flynn Effect by using a regression model which predicted scores on the scholastic assessment tests based on the birth cohort and the country that took the test, and I found no time trend. Because of that, I think it’s fair to conclude that most of these changes reflect real changes in cognitive performance.
Trends
I ignored countries if they had less than 7 unique cohort years or less than 10 different observations, as the power to detect changes across time. Non-linear trends were plotted using LOESS, and p-values were computed for the non-linear trends by comparing a restricted cubic spline model to a linear model.
It’s worth mentioning that the p-value does not give the probability that the trend is true, it gives the probability that the trend (or one more extreme than it) would be observed under the null hypothesis, so in practice interpreting p-values can be tricky. Based on the p-value distribution of the linear trends, most of the values under .03 should be true hits.
These are the national averages, caculated by averaging the results of three estimation methods:
Weighing the averages of the TIMSS, PISA, PIRLS, IQ, EGRA, LLECE, PIAAC, PASEC, SACMEQ, and PLM tests by the square root of the number of samples each country had.
Taking the arithmetic mean with no regard for sample sizes.
Using the median.
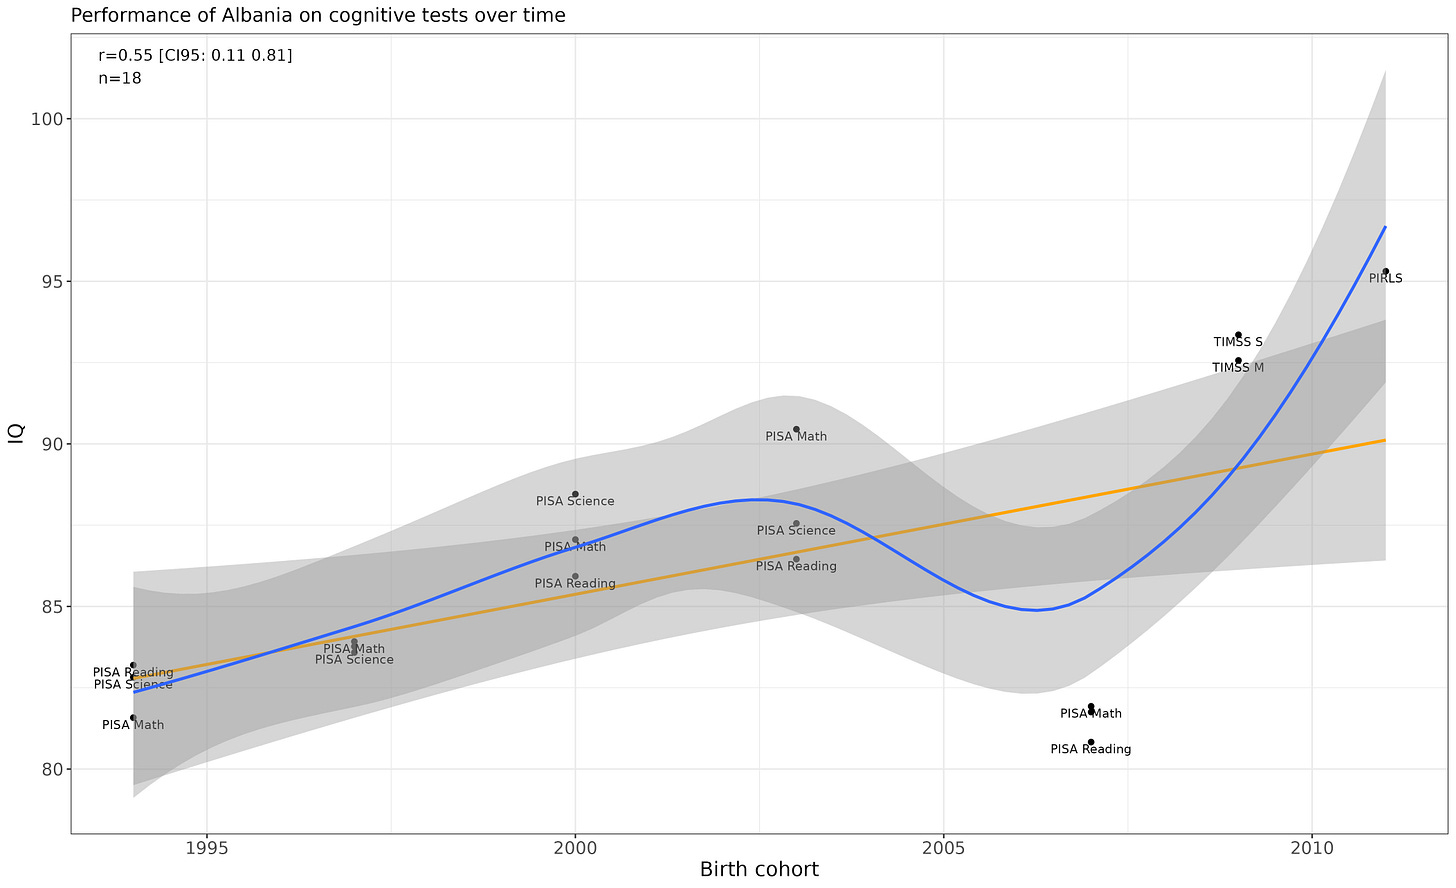
Albania
The differences in means over time appear to be due to the TIMSS/PIRLS results being anomalous. Otherwise, Albania is consistently scoring at an IQ of ~85.
United Arab Emirates
Ignoring the one low IQ result from the 80s, stagnant.
Argentina
Flat trend, with the exception of the fluked PISA scores in 2000, which were sampled from Buenos Aires.
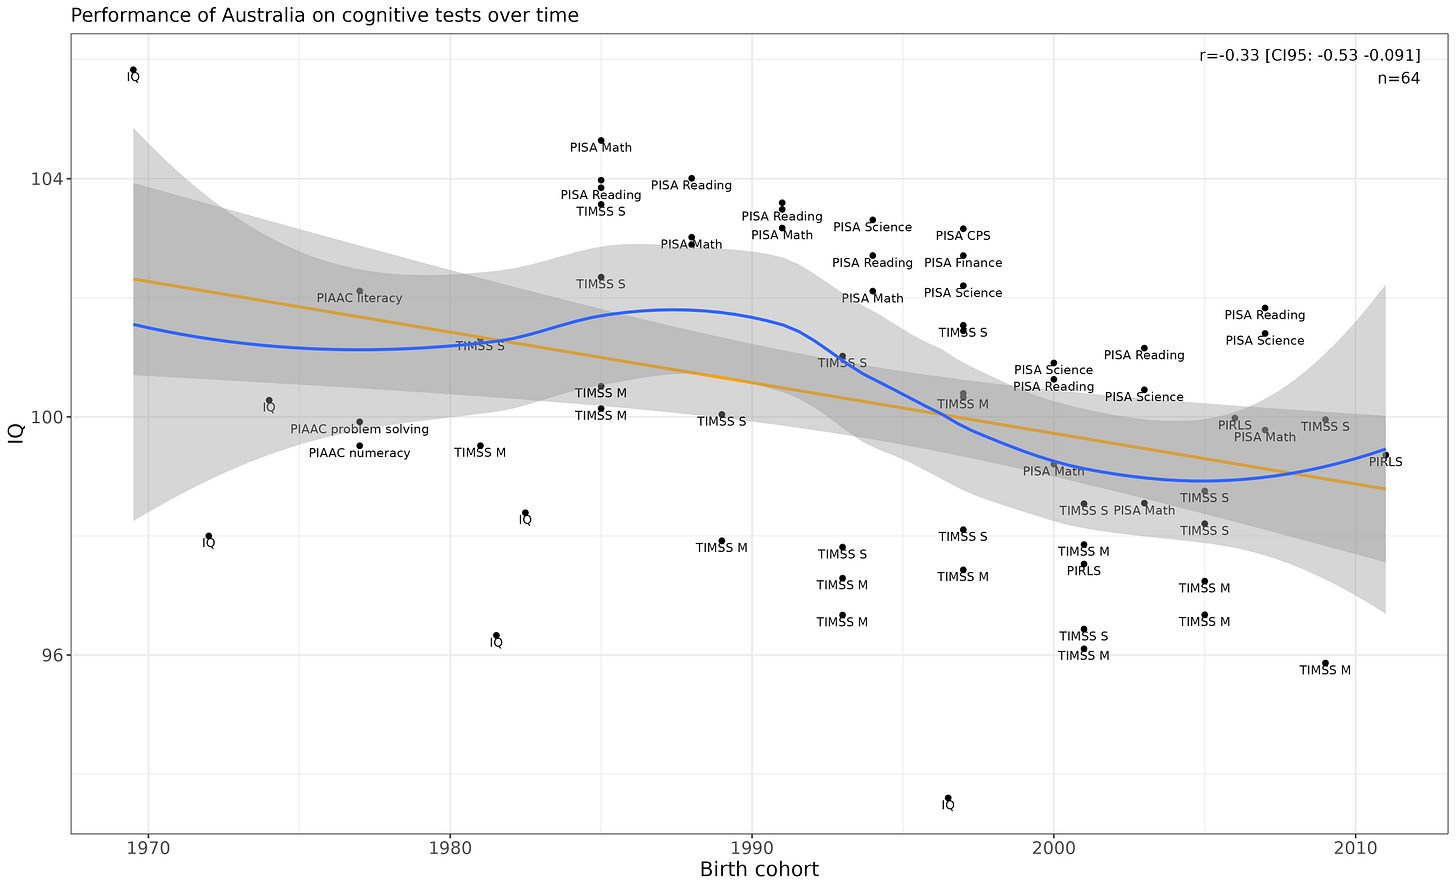
Australia
Linear p-value is .02, non-linear p-value is .008. The decline within assessments (particularly the PISA ones) is visually notable.
Austria
Flat.
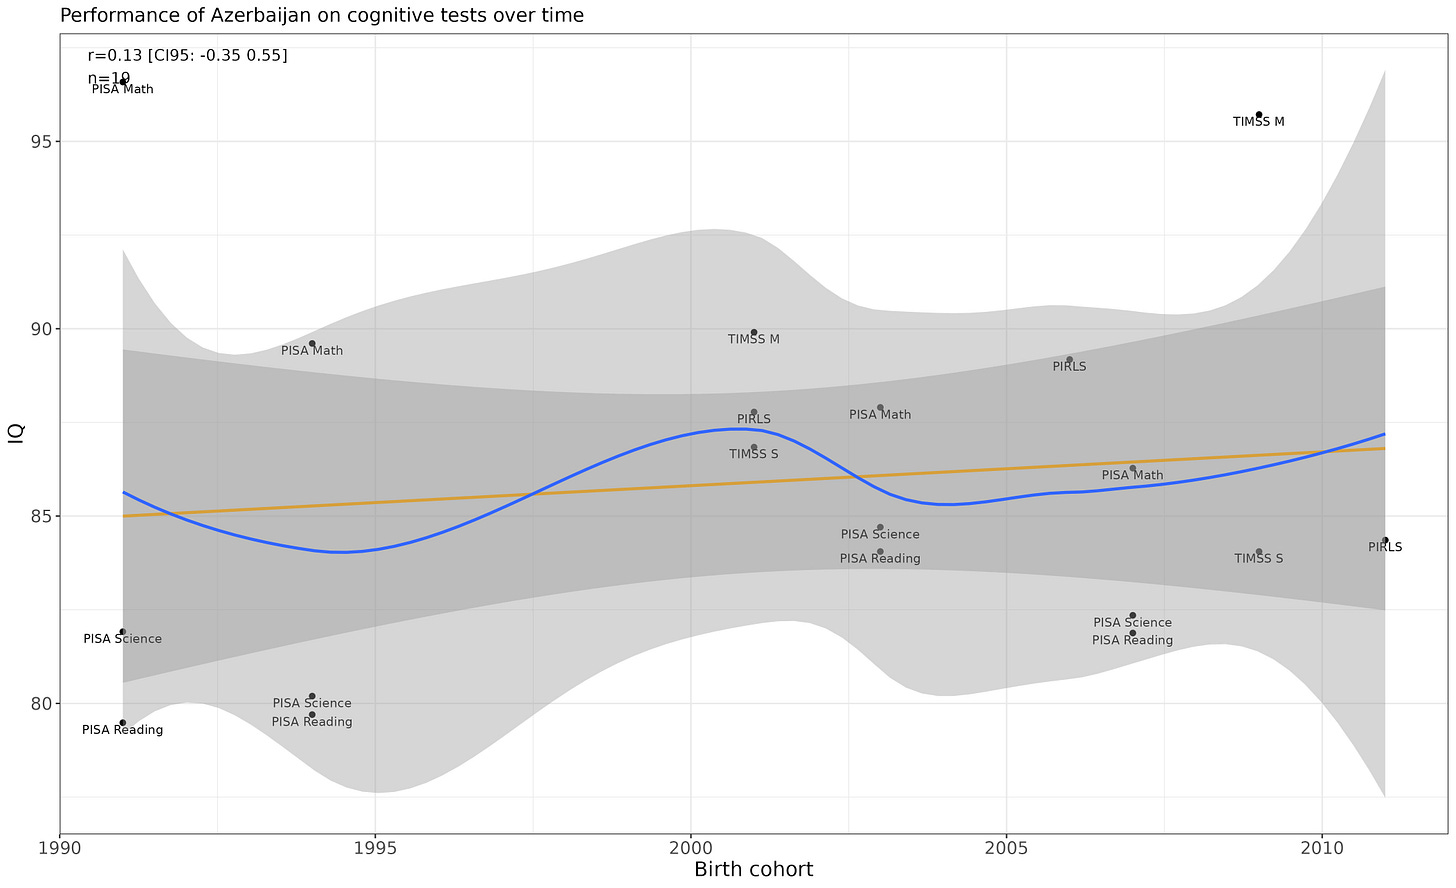
Azerbaijan
Hard to tell because the results are inconsistent, but looks flat.
Belgium
p = .003 for the linear decline.
Bulgaria

Does well on the TIMSS/PIRLS, but not on the PISA. Fairly constant performance.
Bahrain
Linear p-value is .02. I think the trend is real because the effect size is large, despite the fact the p-value is not good.
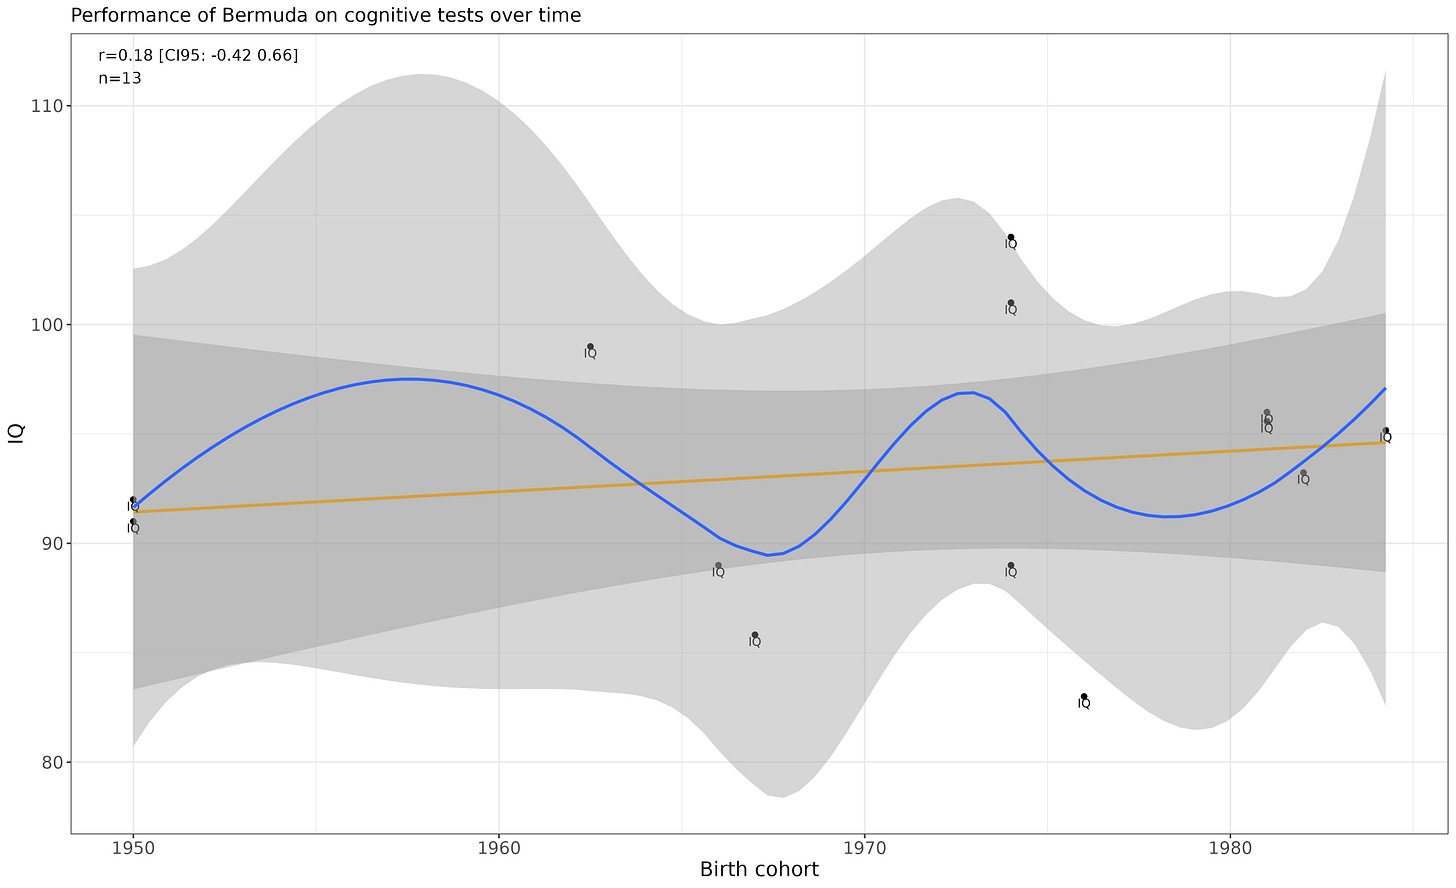
Bermuda
Flat.
Brazil
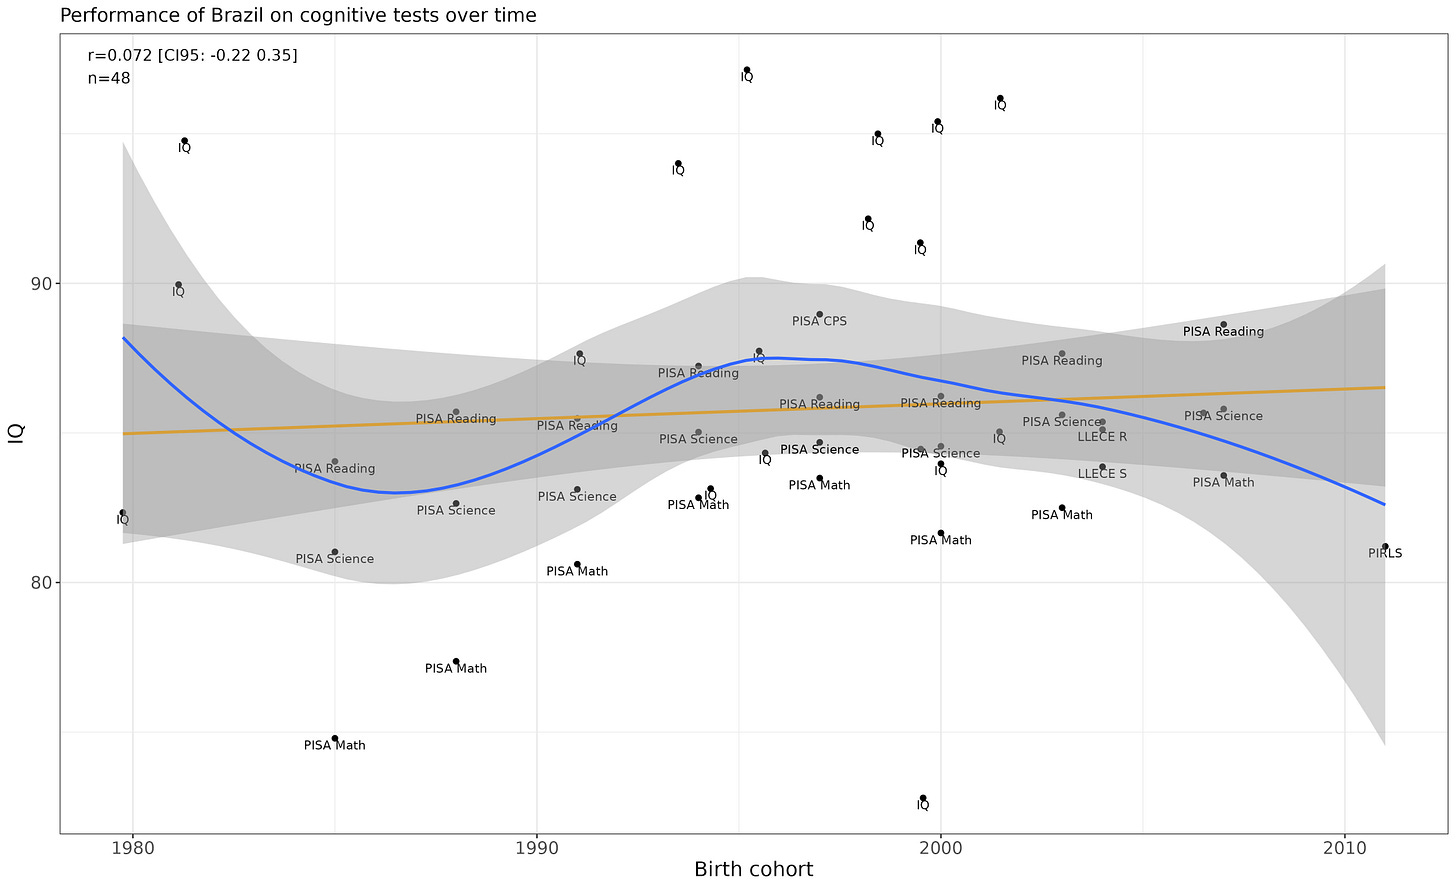
Scores well in Becker’s IQ samples, but not on scholastic samples. Flat performance.
Botswana
Flat performance.
Canada
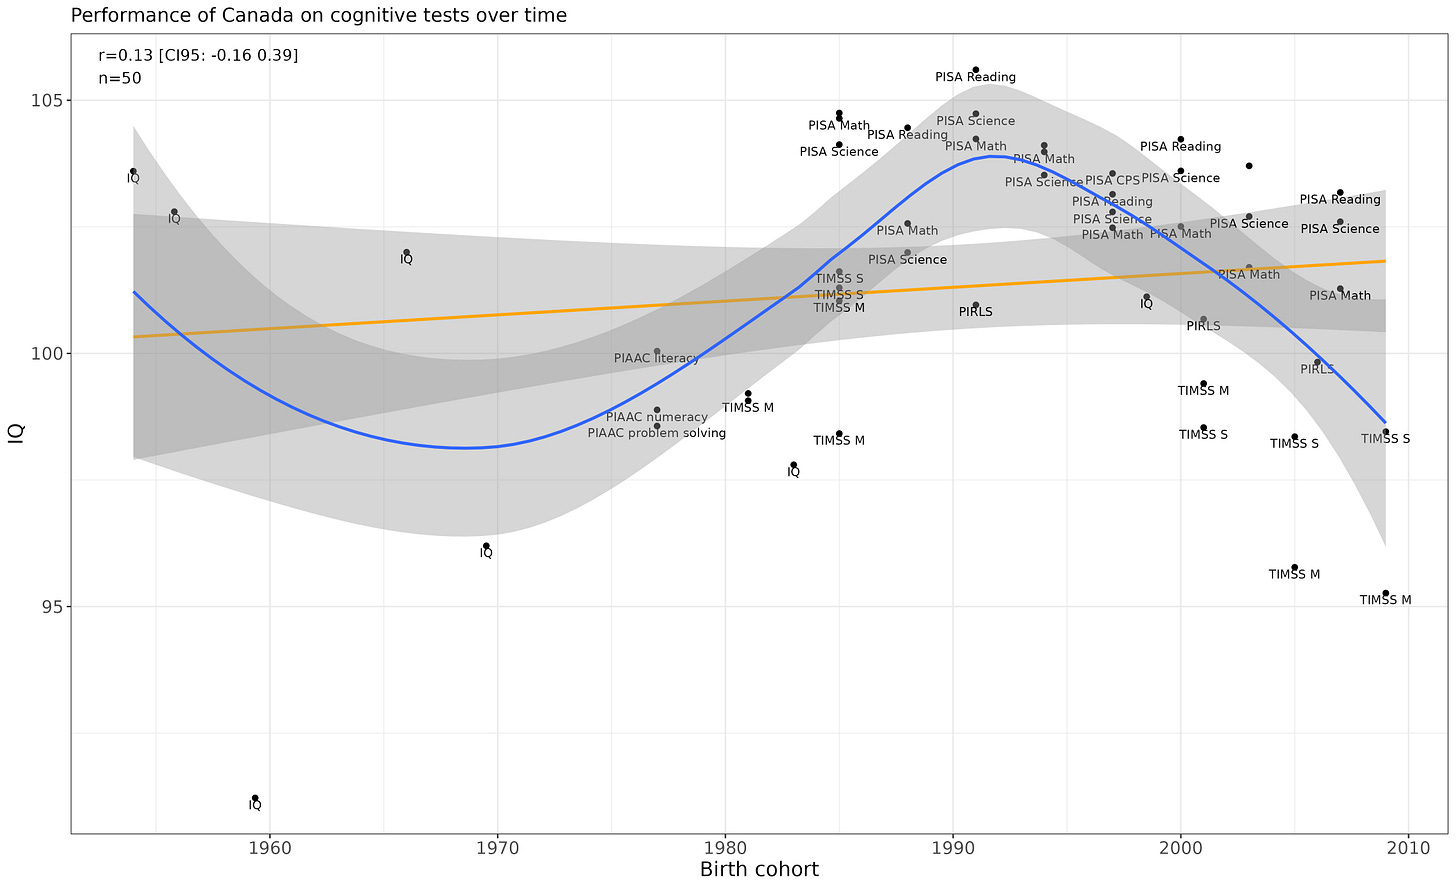
Notable decline past 1990. p = .0004 for the non-linear trend.
Switzerland
Both p-values are substantially above .05.
Chile
Both p-values are substantially above .05.
China
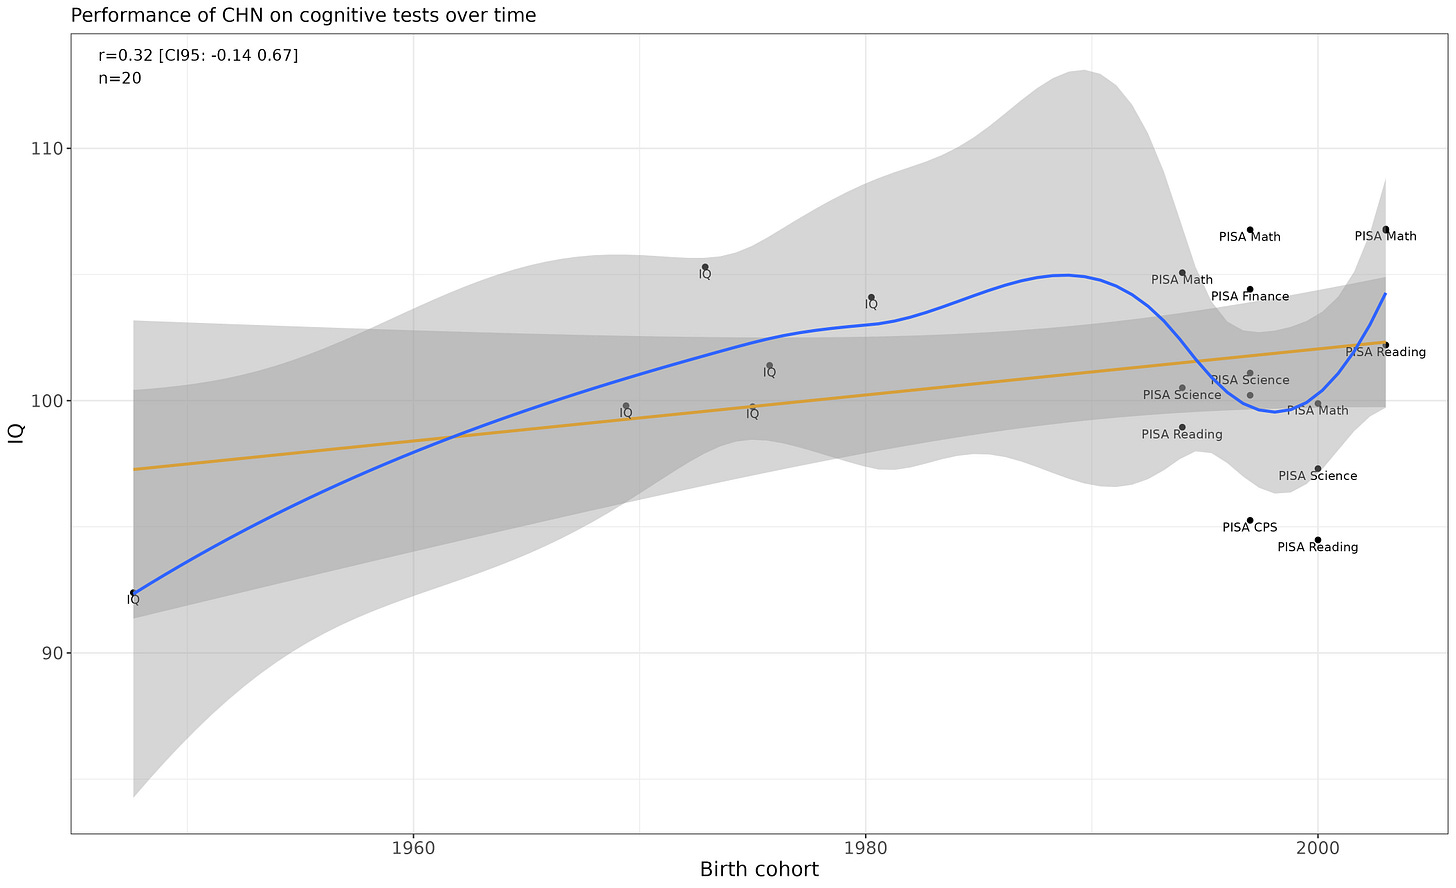
Flat performance (note: these figures were corrected for the fact that non-representative samples were collected in both the IQ samples and the PISA samples).
Democratic Republic of the Congo

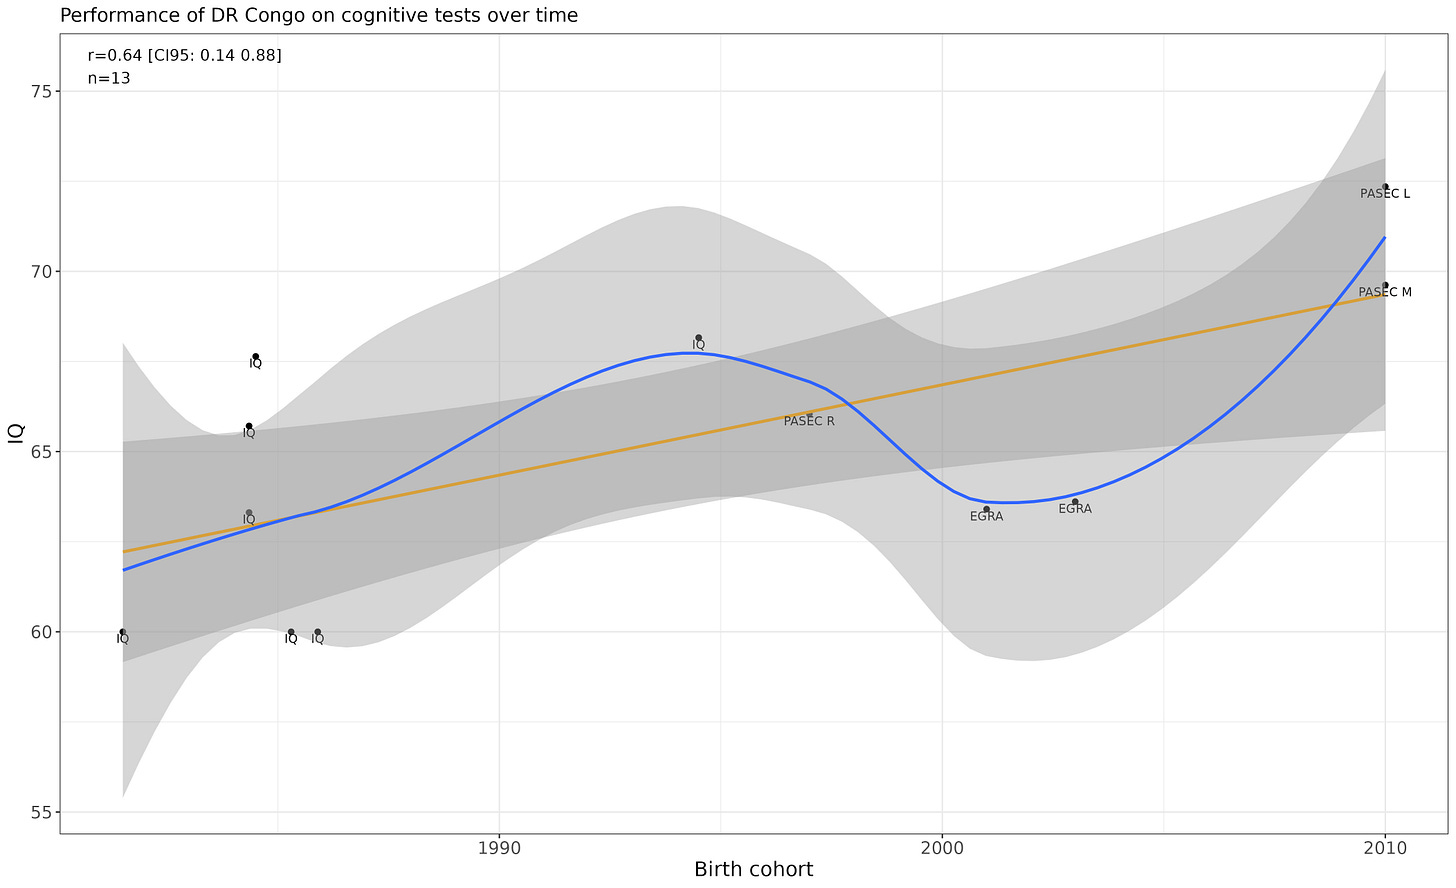
Linear p-value is p = .02. I don’t trust this trend because it looks driven by the fact that it recently overperformed on the PASEC.
Colombia
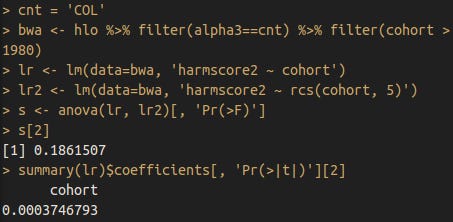
Fairly convincing linear p-value (p = .0004).
Costa Rica
Flat trend.
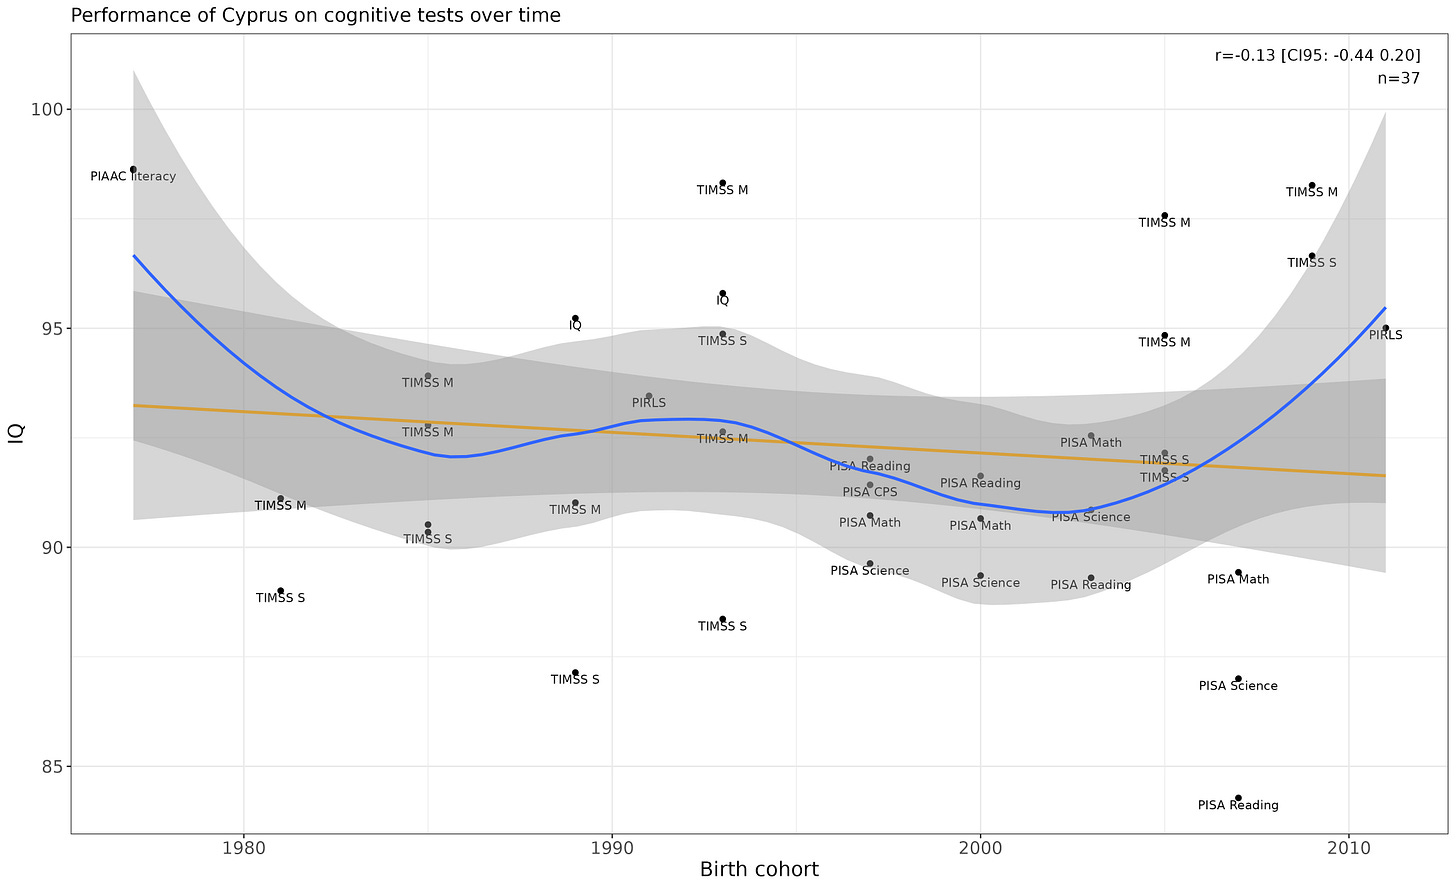
Cyprus
Flat performance. Ignore the non-linear trend, the p-value is .27.
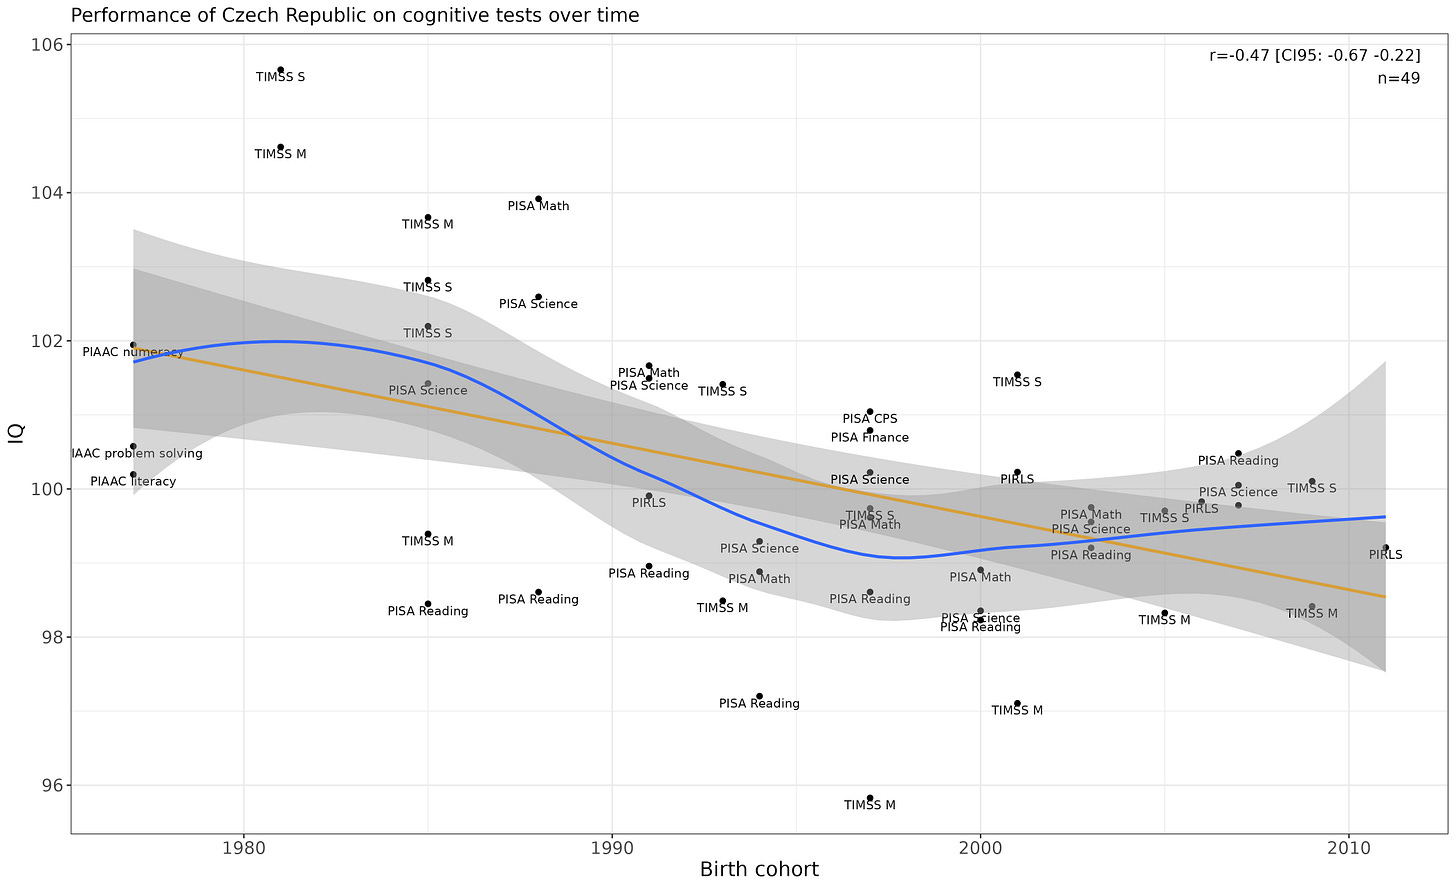
Czech Republic
Fairly convincing linear p-value (p = .0006).
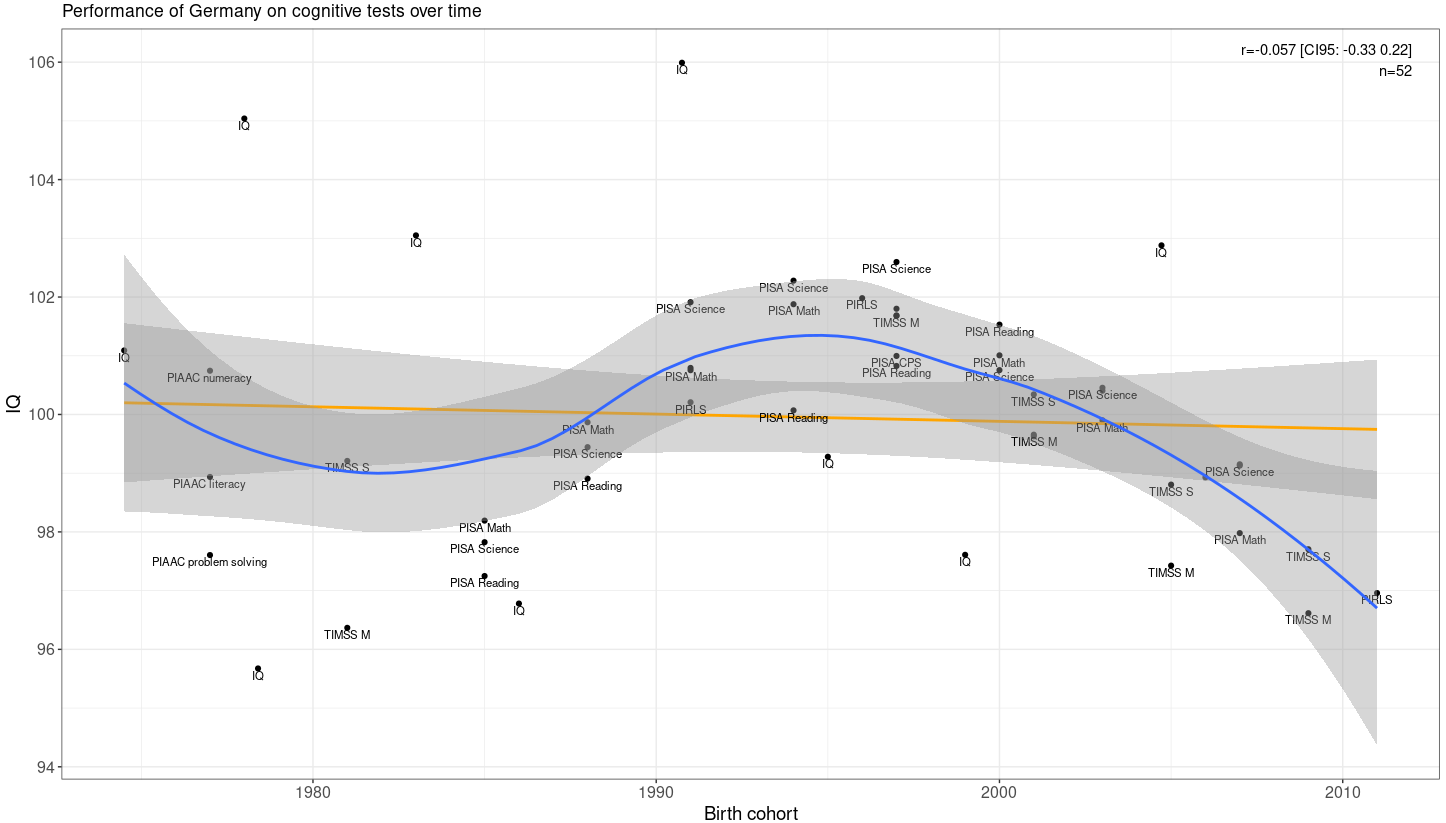
Germany
Rise from the 80s to 90s, drop afterwards. Convincing non-linear p-value (p = .001).
Denmark
Nothing of note here, besides a possible recent decline in recent years. Removing the anomalous pre 1970 results does not change the p-values.
Dominican Republic
Flattish trend.
Ecuador
Flat.
Egypt
Possible decline, but doesn’t pass significance testing.
Spain
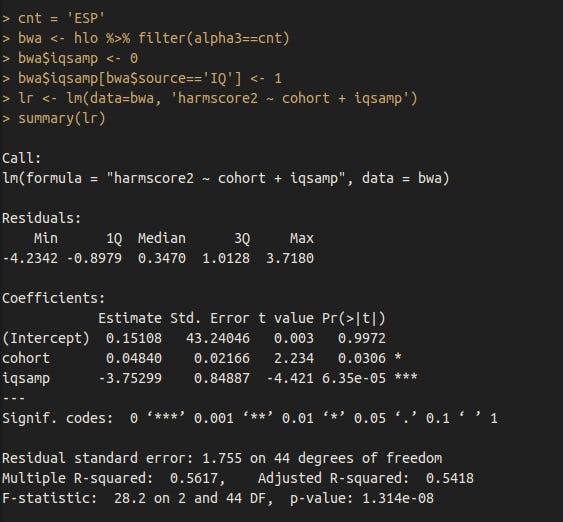
Clear positive trend when the IQ results are included, but they are not distributed equally across cohorts. Controlling for the fact Spain scores lower on IQ tests in comparison to scholastic ones results in a rather tenuous p-value (p = .031).
Estonia
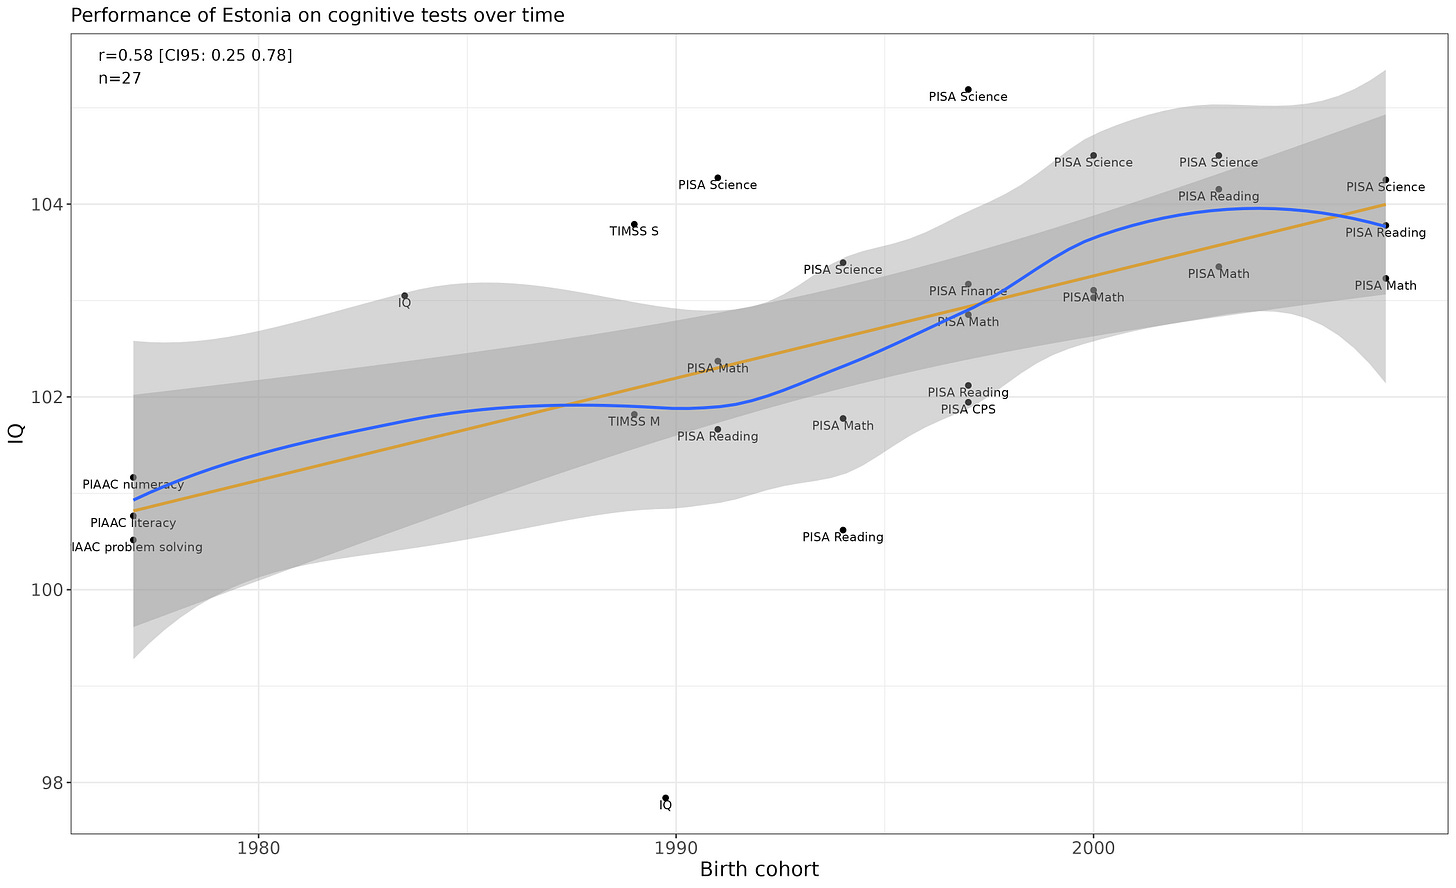
Small, but statistically robust increase (p = .0016 for the linear increase).
Finland
Recent decline that is due to immigration. p = .0004 for the non-linear trend.

France
Awkward non-linear trend, but the linear decline looks fairly robust (p = .0007).
Great Britain
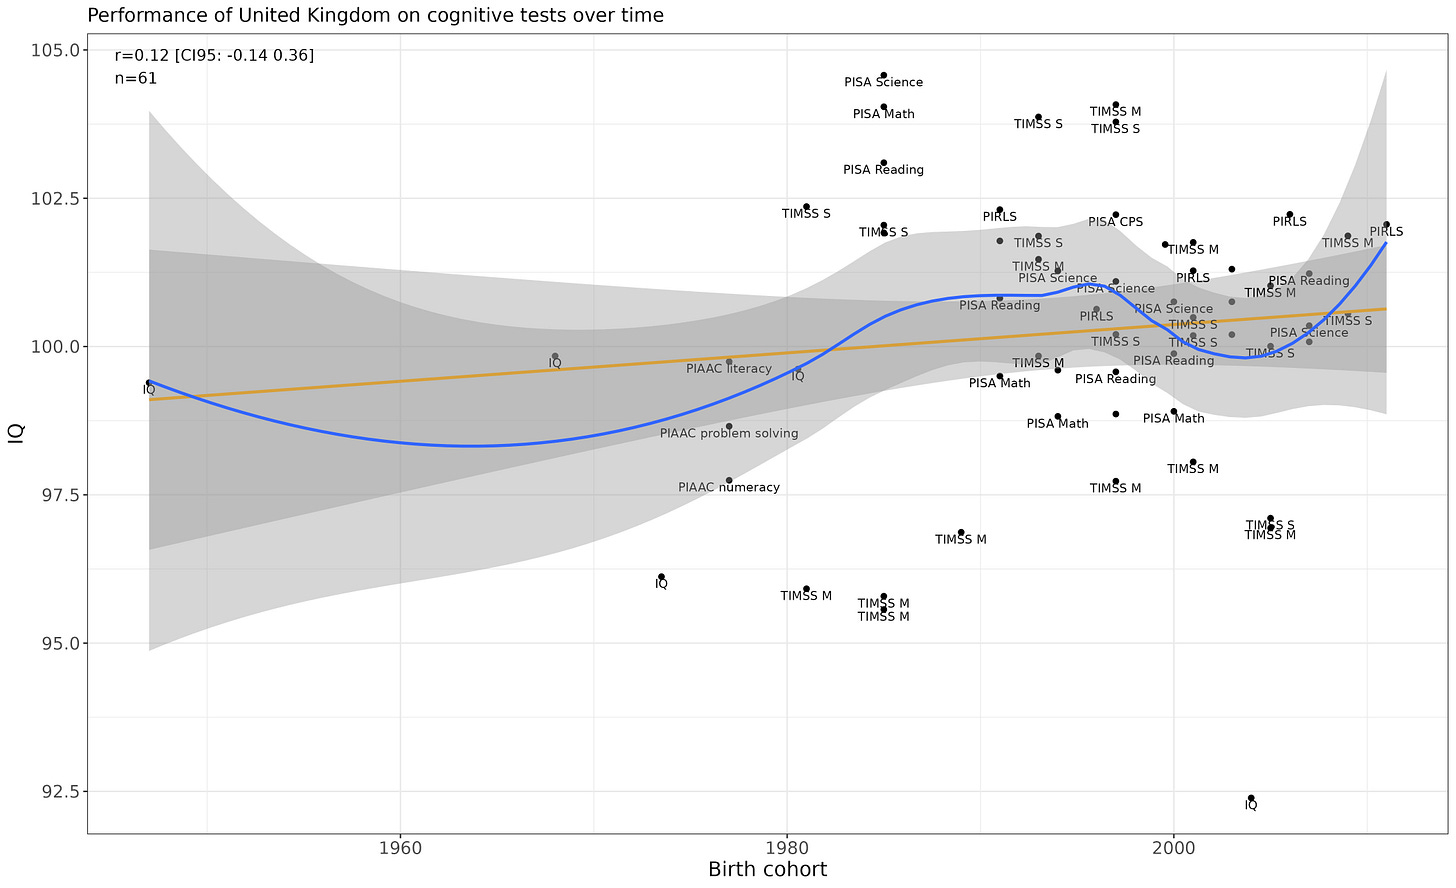
No change over time. The non-linear trend is a fluke.
Georgia
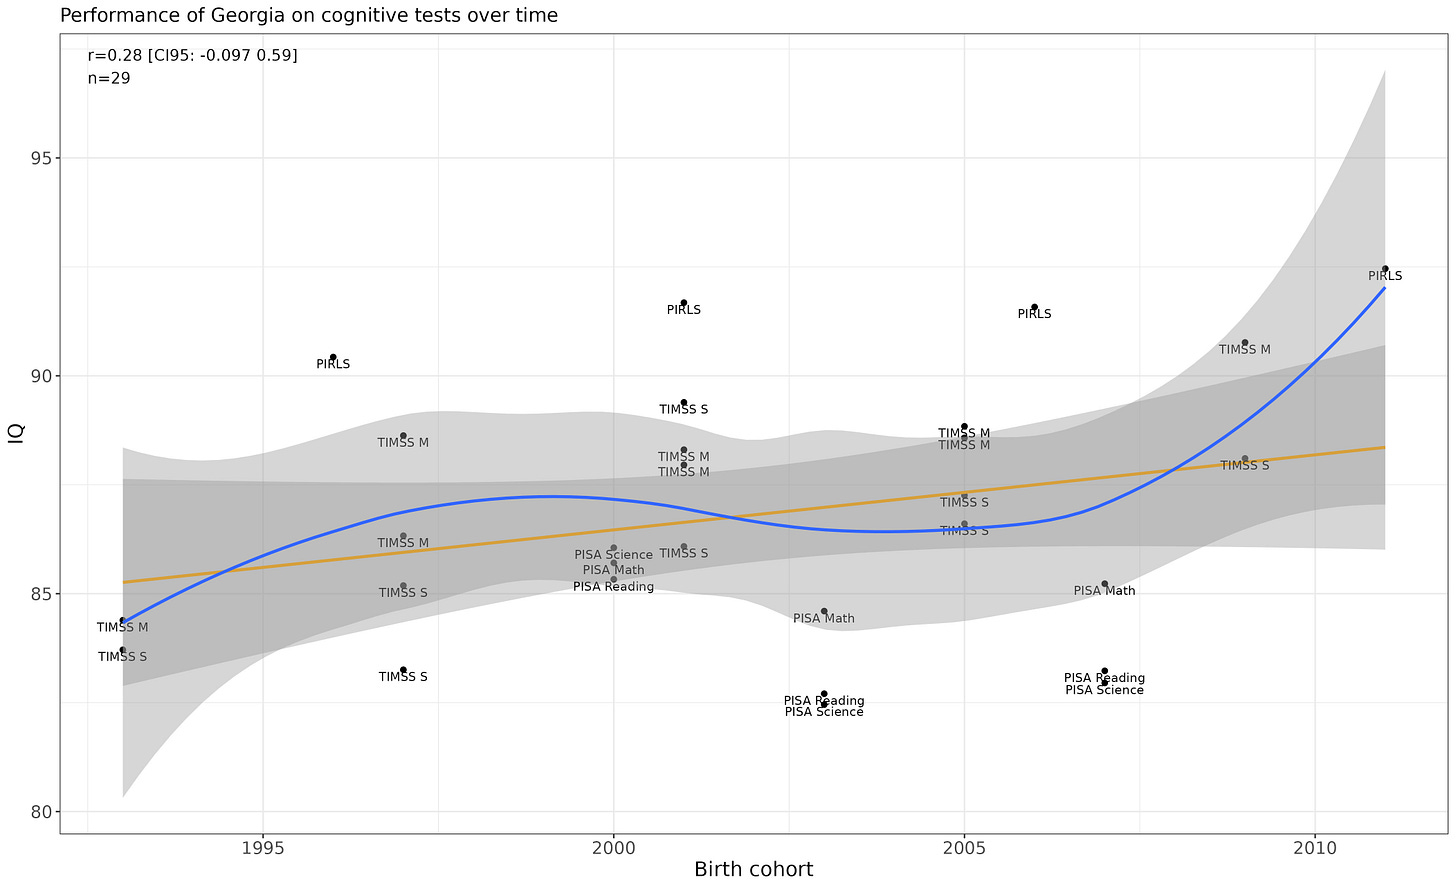
Flat.
Ghana
Probably a fluke, but hard to tell with so little data.
Greece
The p-value for the non-linear trend is iffy (p = .01), but visually compelling (e.g. compare the PISA reading results across time).
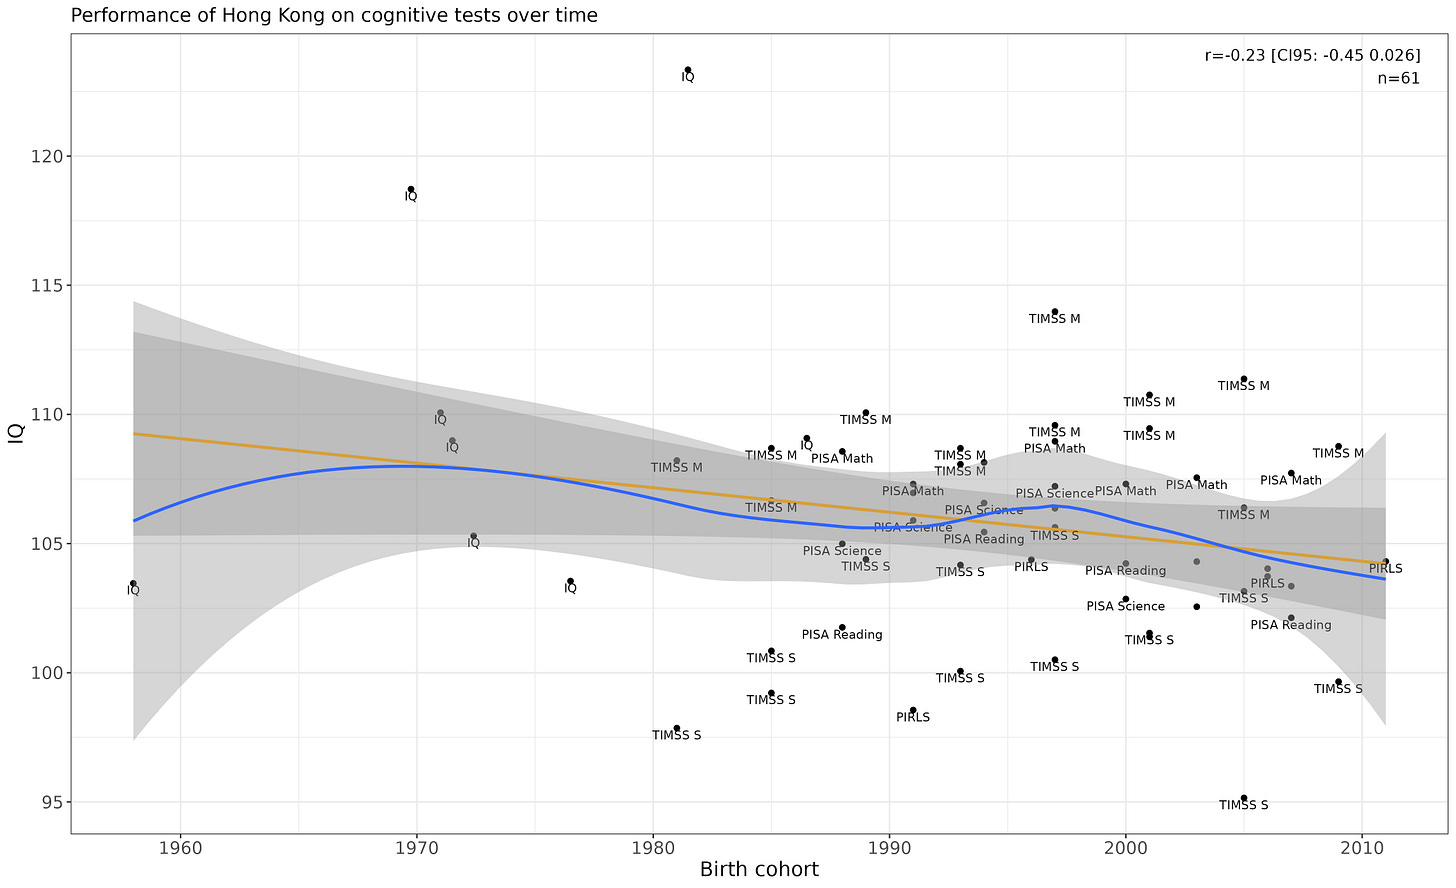
Hong Kong
Looks flat.
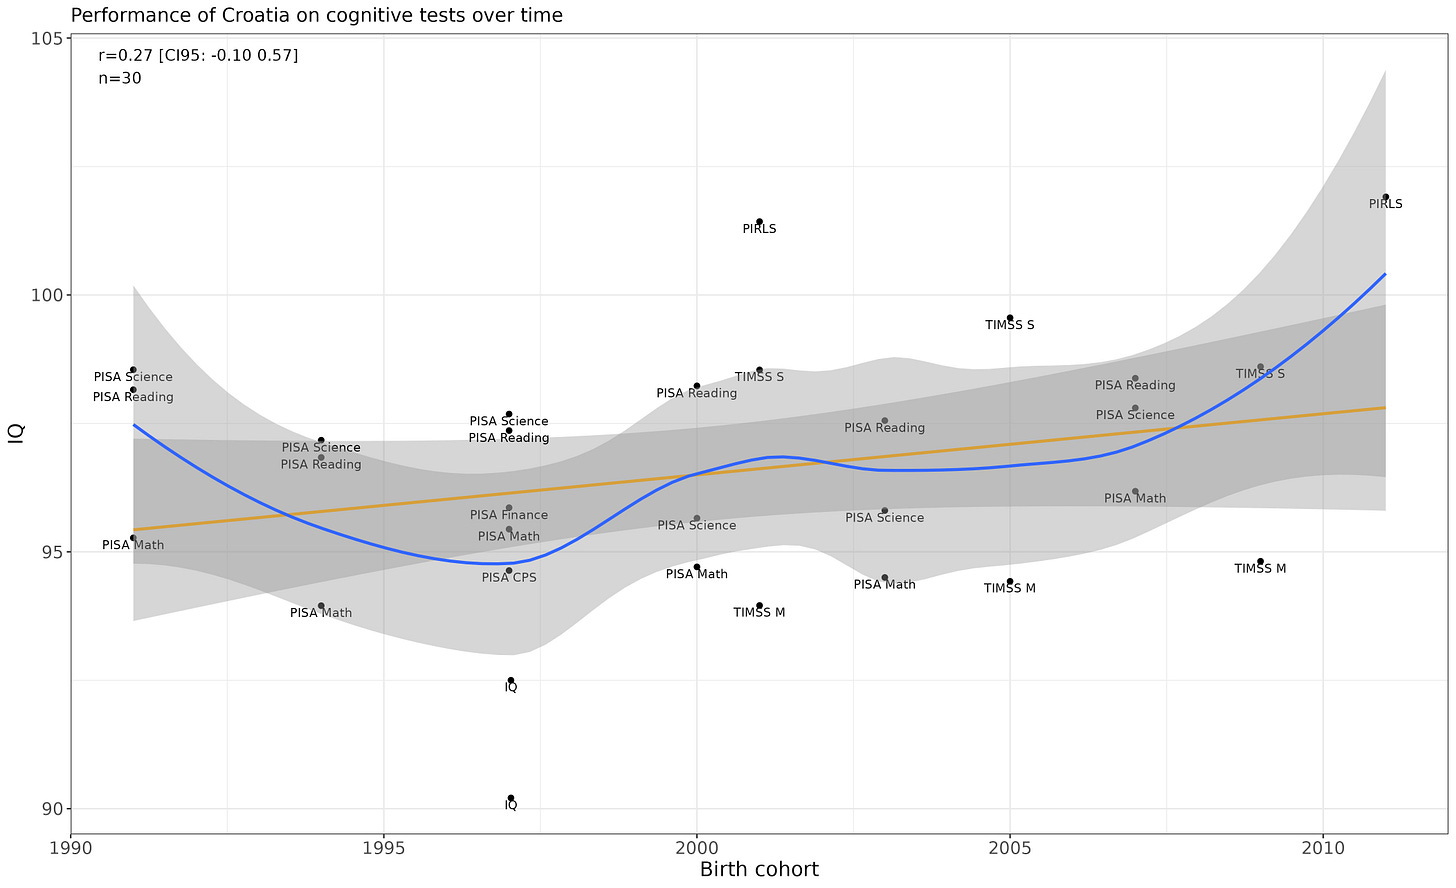
Croatia
Flattish.
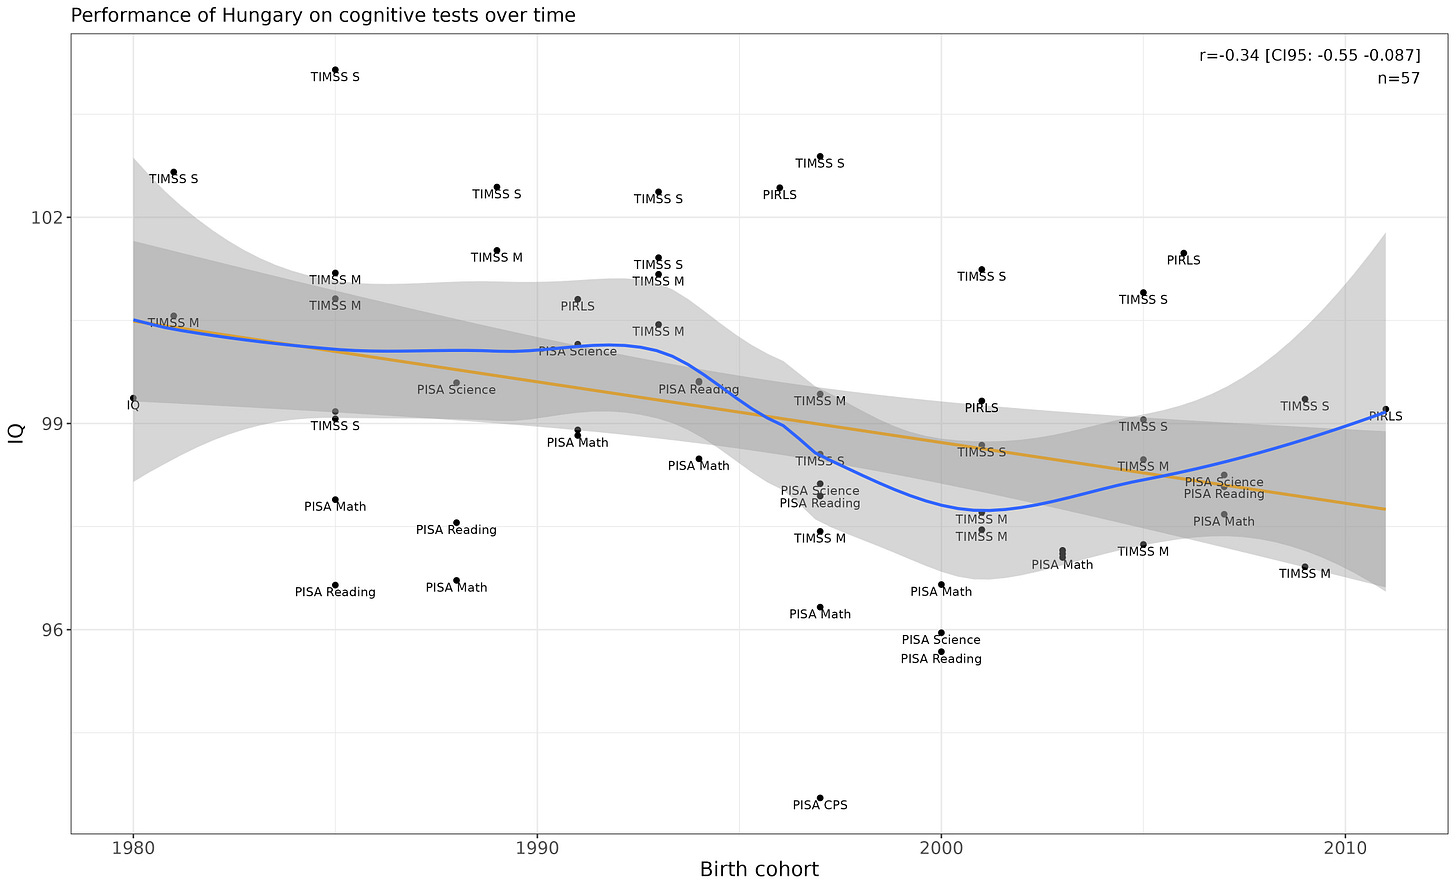
Hungary
The linear p-value passes significance testing (p = .0097).
Indonesia
Flat.
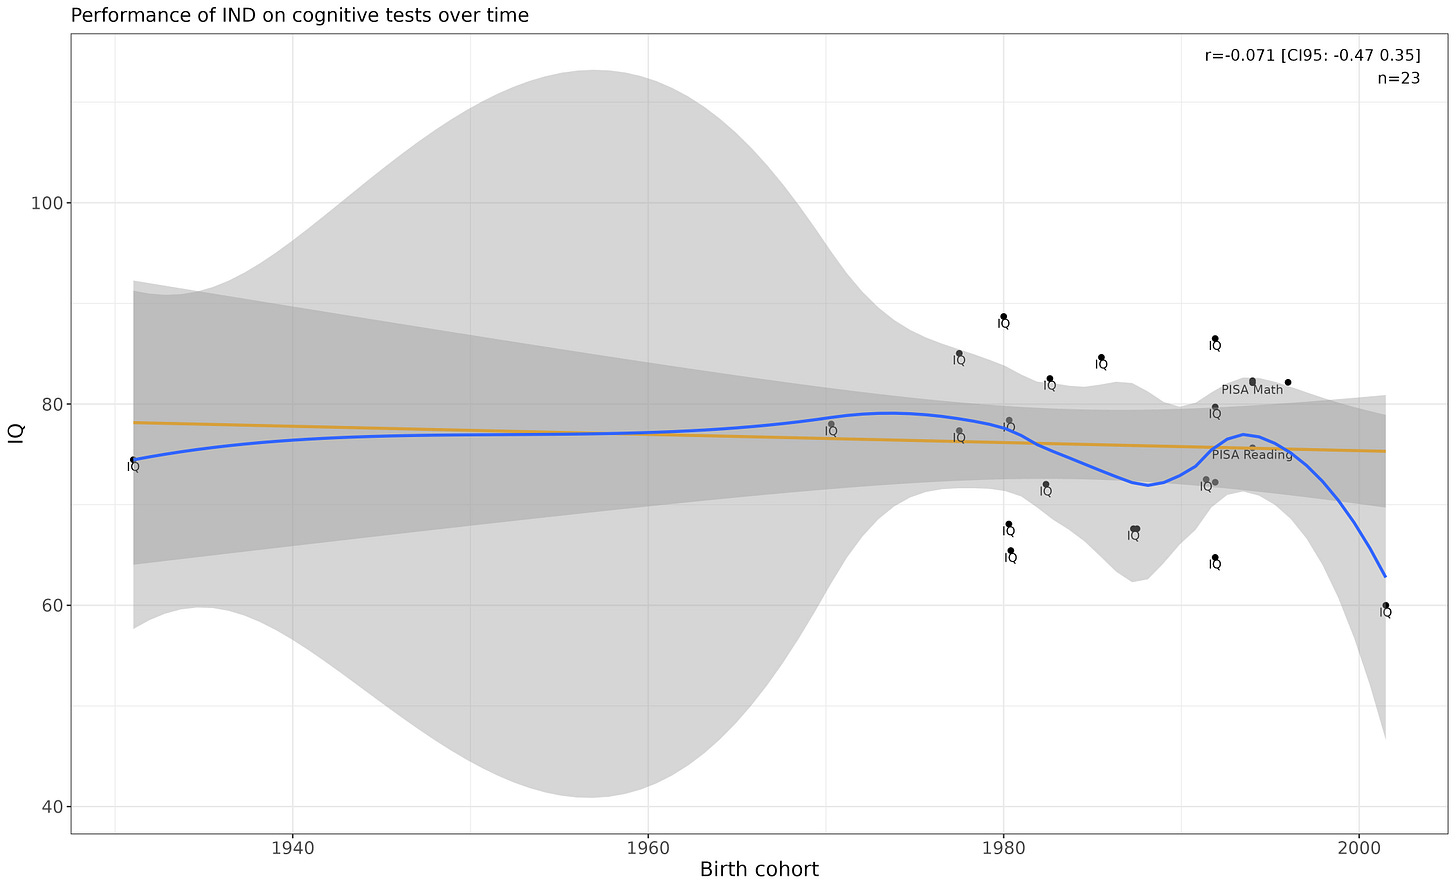
India
Awkward chart, but has flat performance.
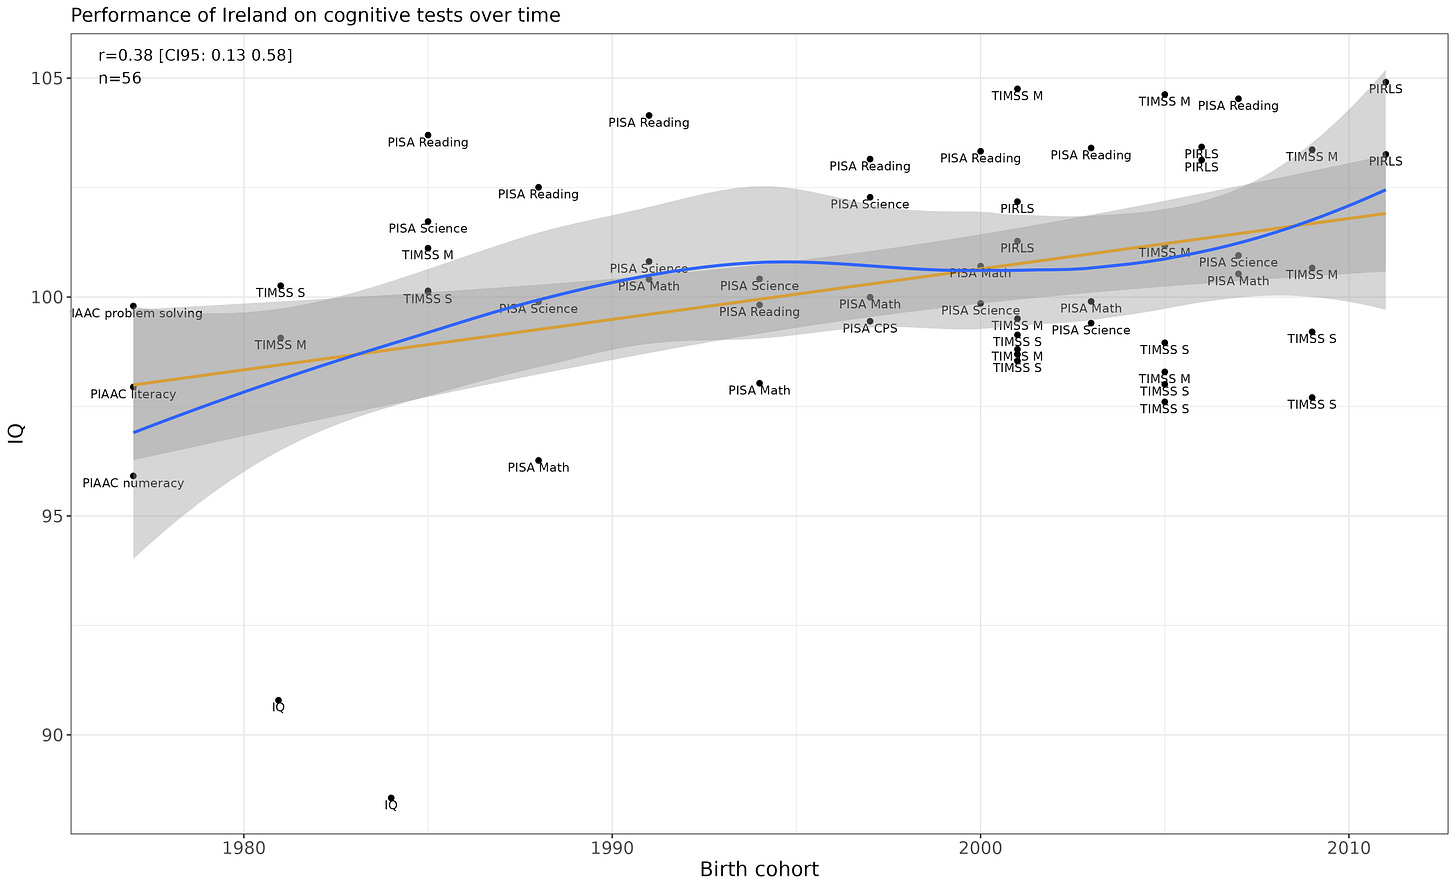
Ireland
Possible increase (linear p-value = .0043).
I tried using the year instead (which has less missing data) and got these results:
After removing the outliers (IQ > 106 or IQ < 90):
The time trend was fairly robust, even after controlling for whether the cognitive test administered was an IQ test.
Iran
Flat. Doubt removing the IQ results would change much.
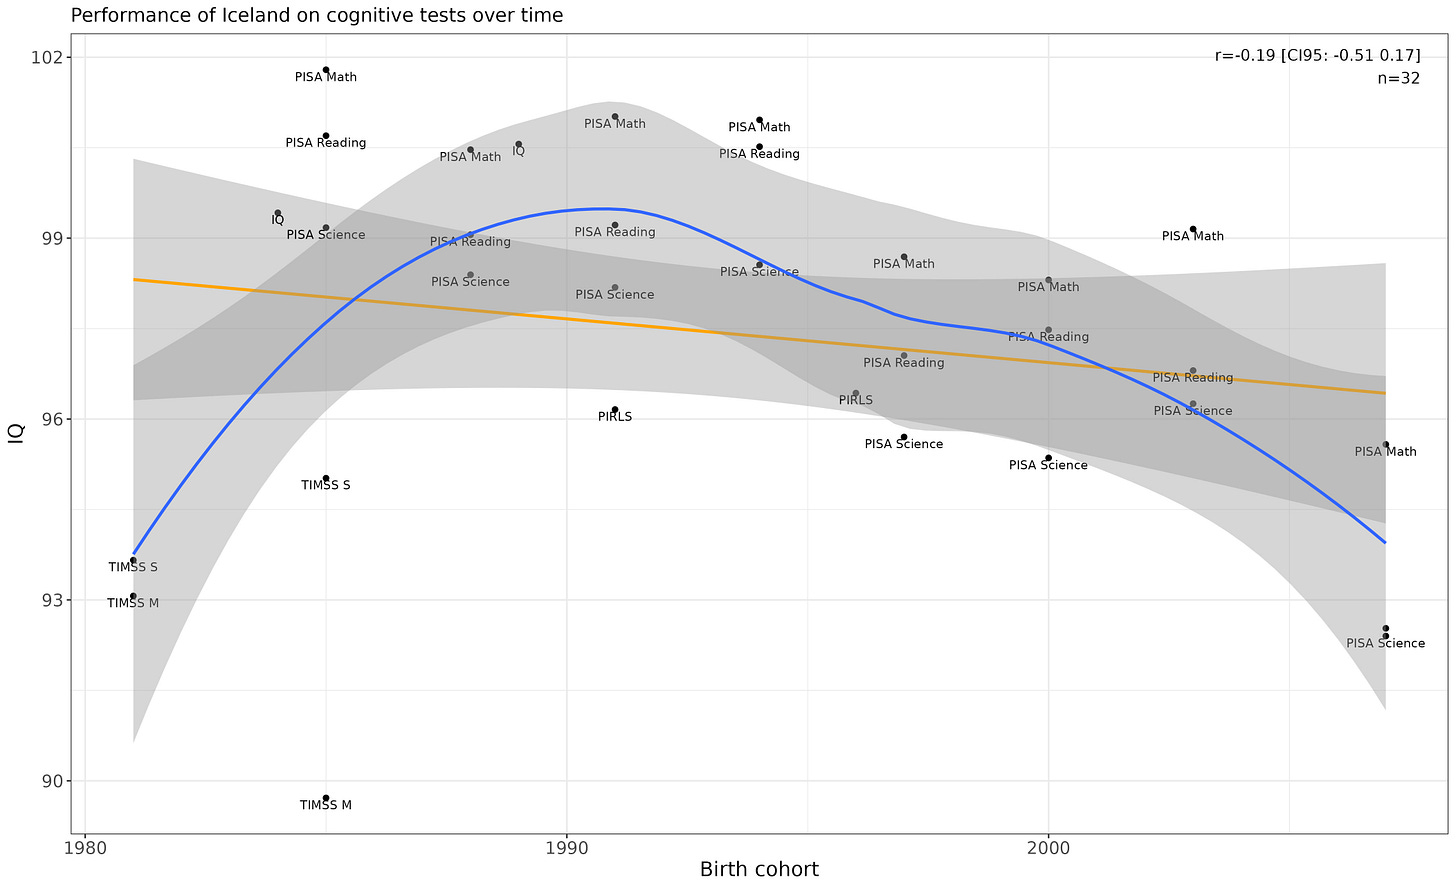
Iceland
Performance may be declining in recent cohorts (p = .0082 for the non-linear p-value).
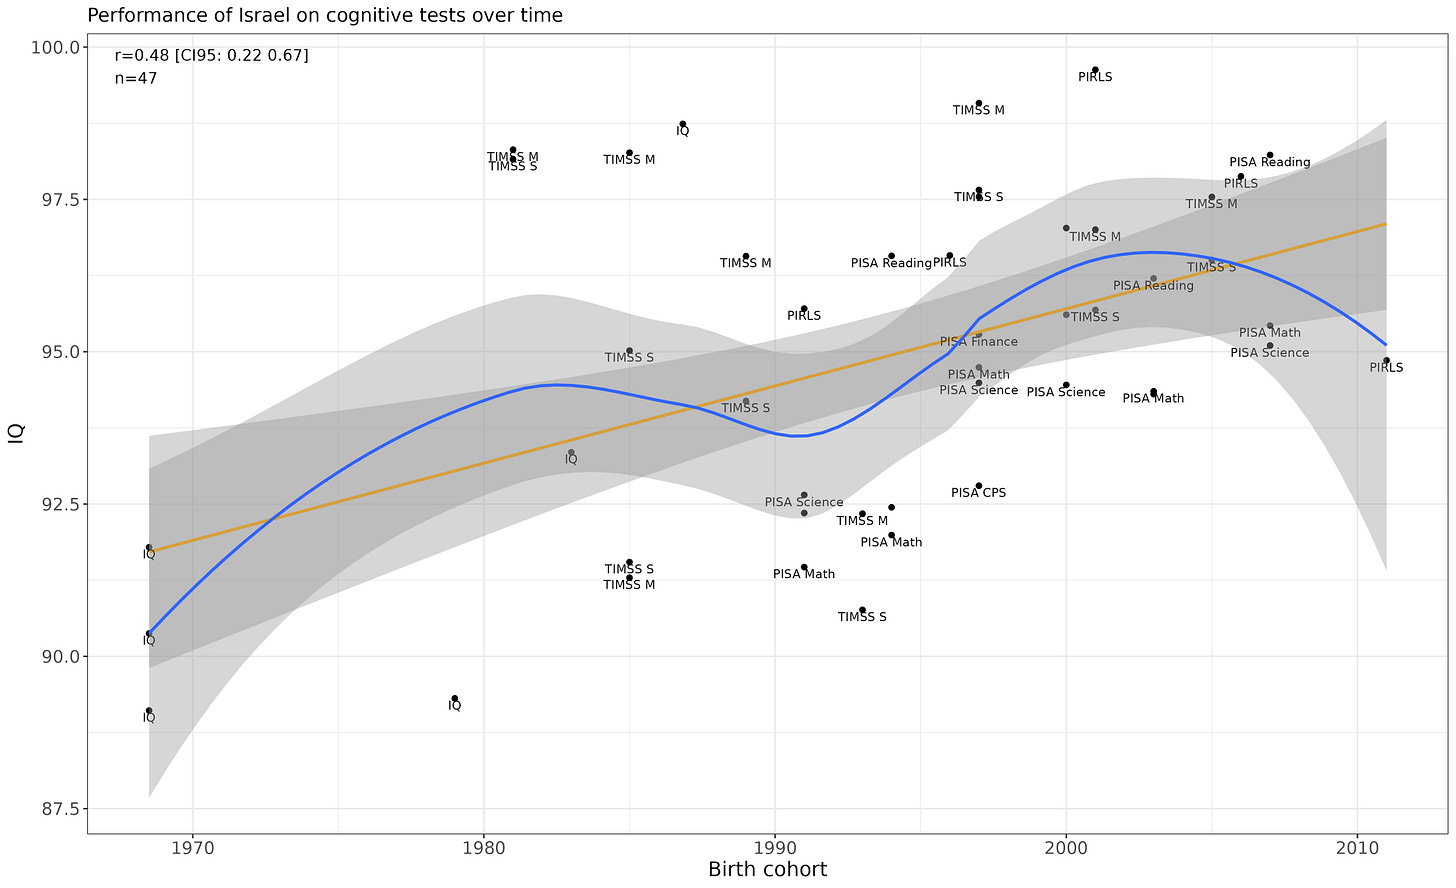
Israel
Linear increase is fairly convincing (p = .00071).
Italy
Weak evidence of a non-linear trend (p = .014), but a p-value this large after gathering so much evidence favours the null.
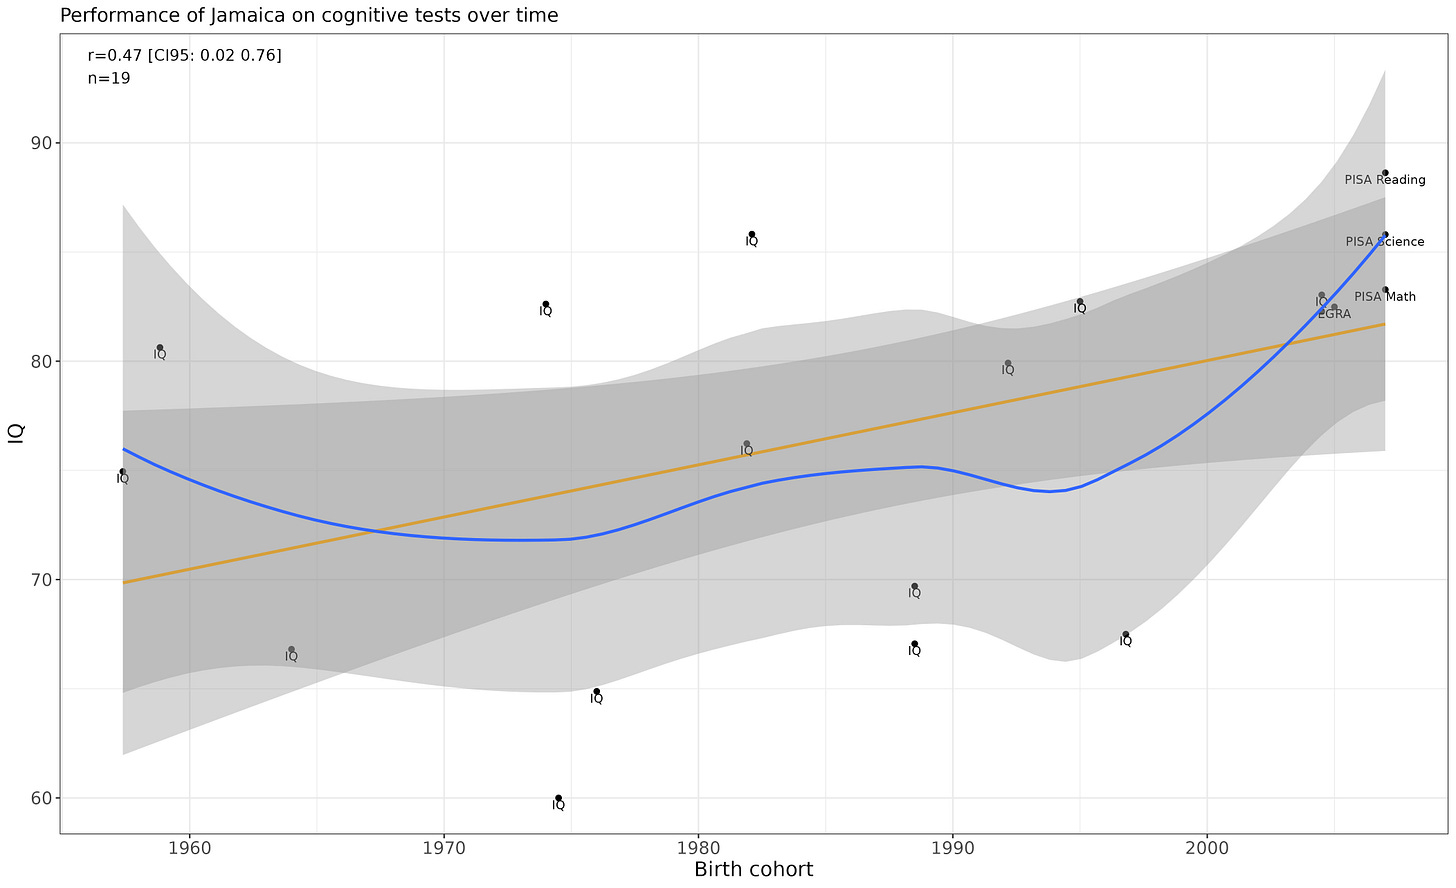
Jamaica
Evidence for the increase looks weak due to the disparities in sample averages.
Jordan
Linear decrease appears convincing (p = .0011).
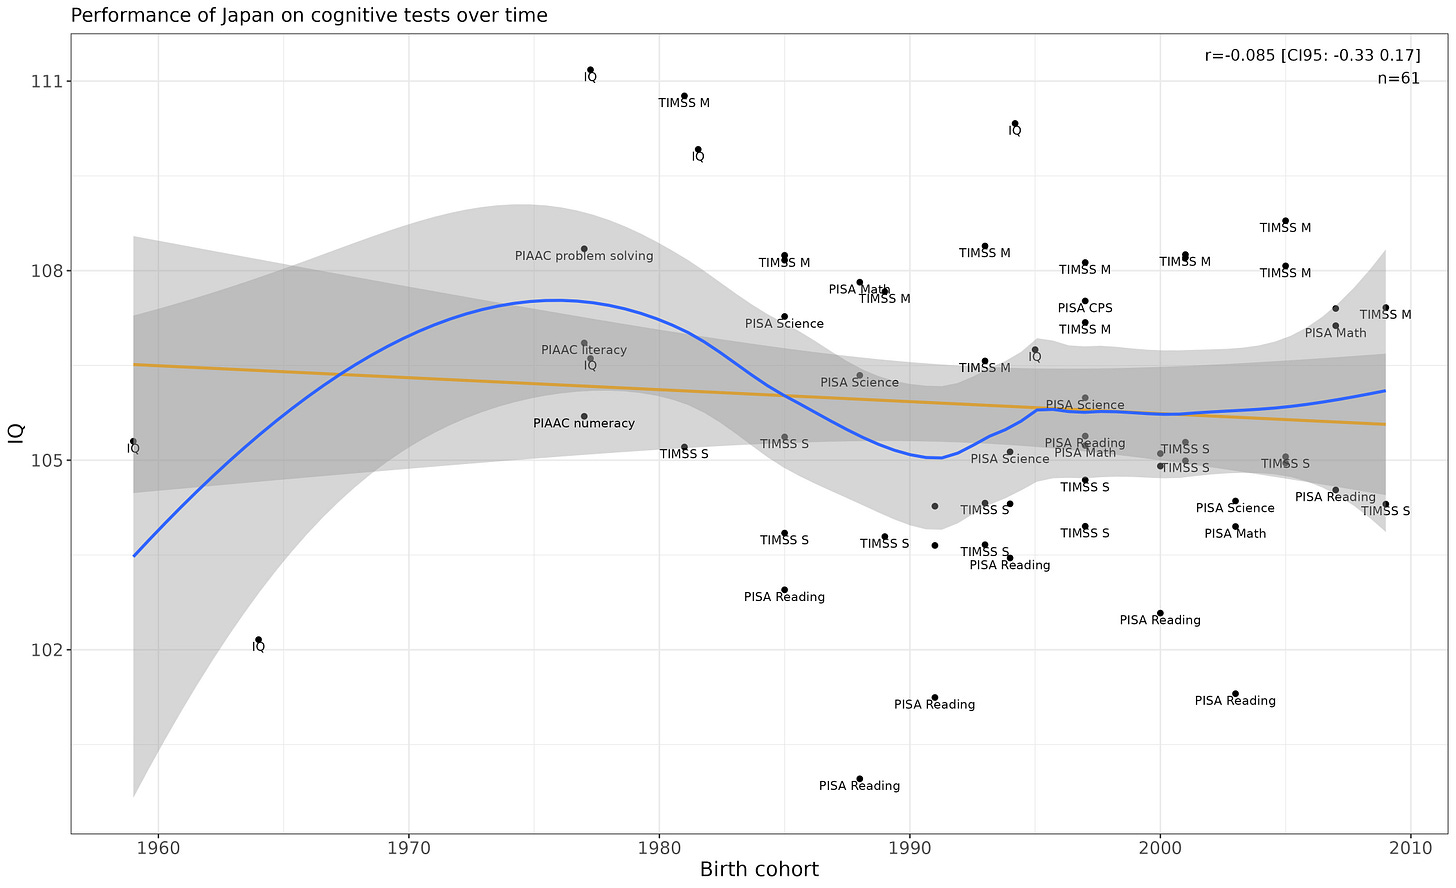
Japan
Flat.
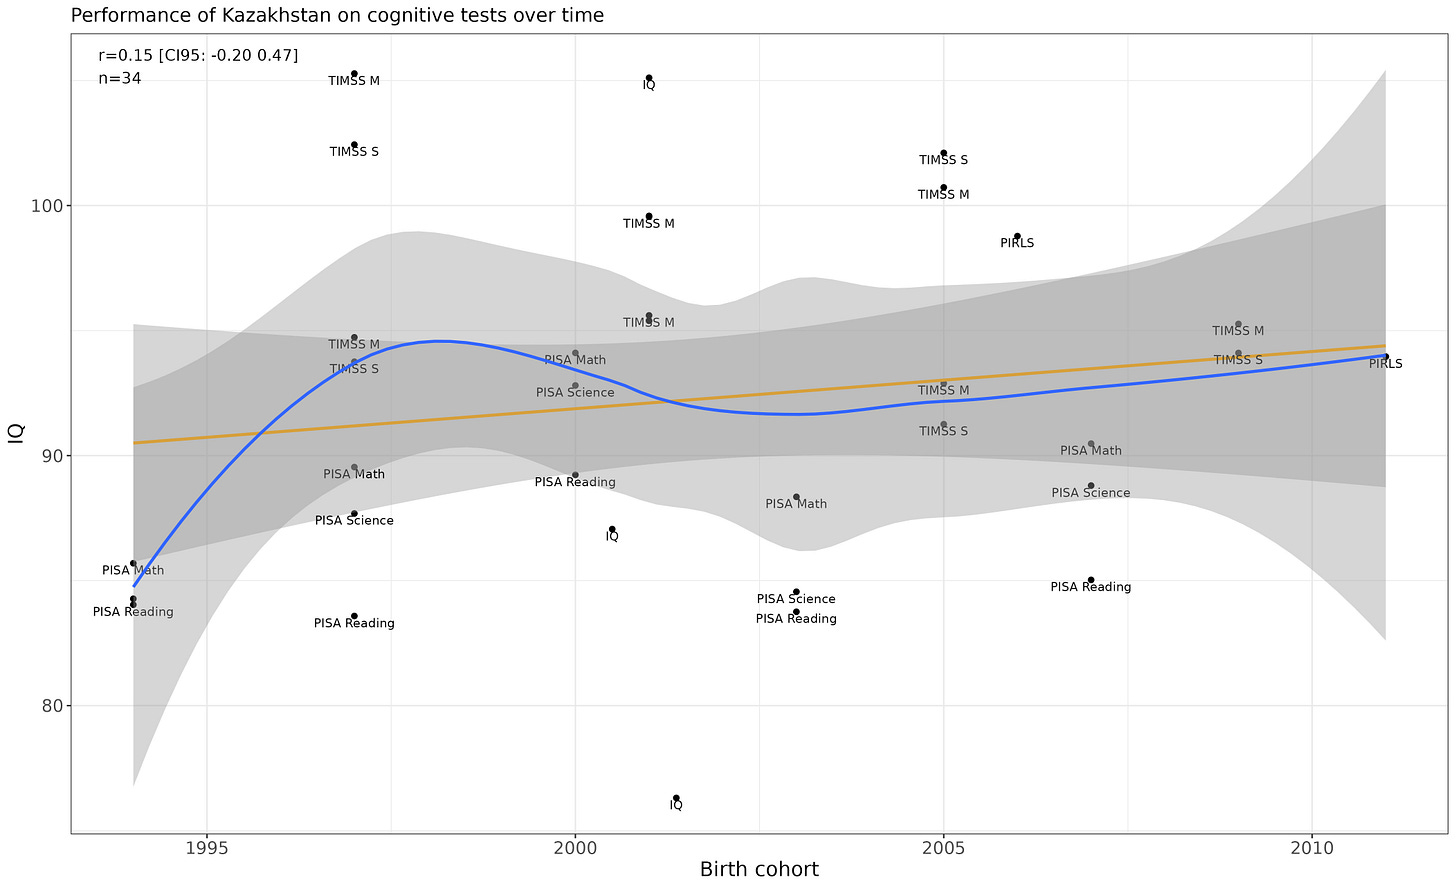
Kazakhstan
No observable increase, but lots of variance in sampling averages.
Kenya
No observable increase.
Cambodia
Nothing to note, but the massive disparities between samples.
South Korea
Performance appears fairly flat.
Kuwait
Evidence for a change is weak (p = .021), and there is no reason a priori (e.g. accelerated dysgenics, immigration, economic collapse) to think that Kuwait’s IQ should have decreased.
Laos (technically this should not have gotten through)
Extremely large inconsistencies between samples makes inferences difficult to make.
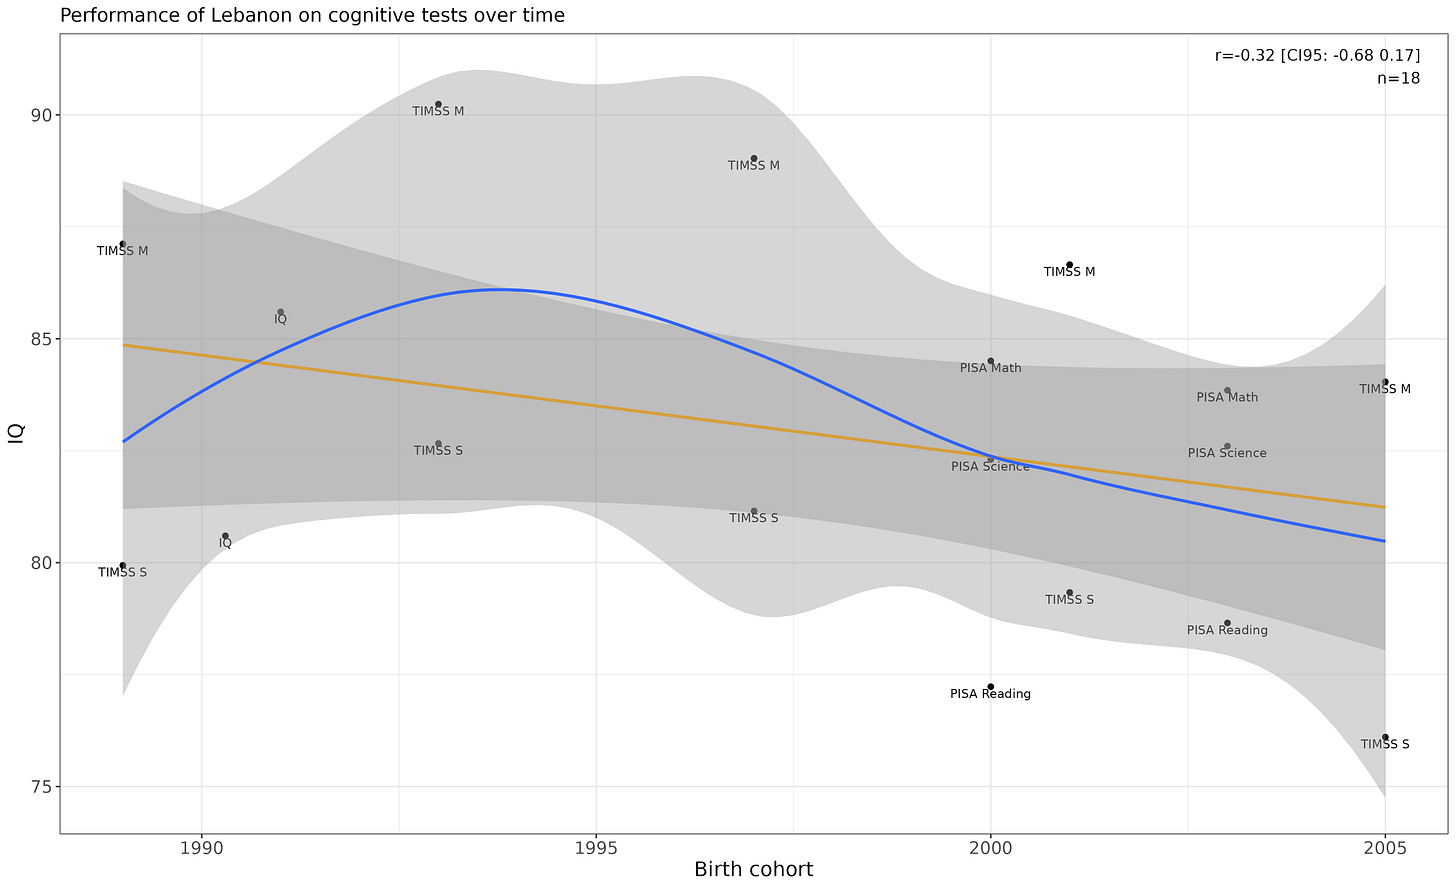
Lebanon
Nothing on note, both p-values are above .10.
Lithuania
Convincing linear increase (p = .00006). Nonlinear model is a somewhat better fit (p = .0012).
Luxembourg
Scored anomalously low on the first PISA wave, otherwise performance has been fairly flat.
Latvia
Similar trend to Lithuania. Both the linear and nonlinear p-values are sub .01.
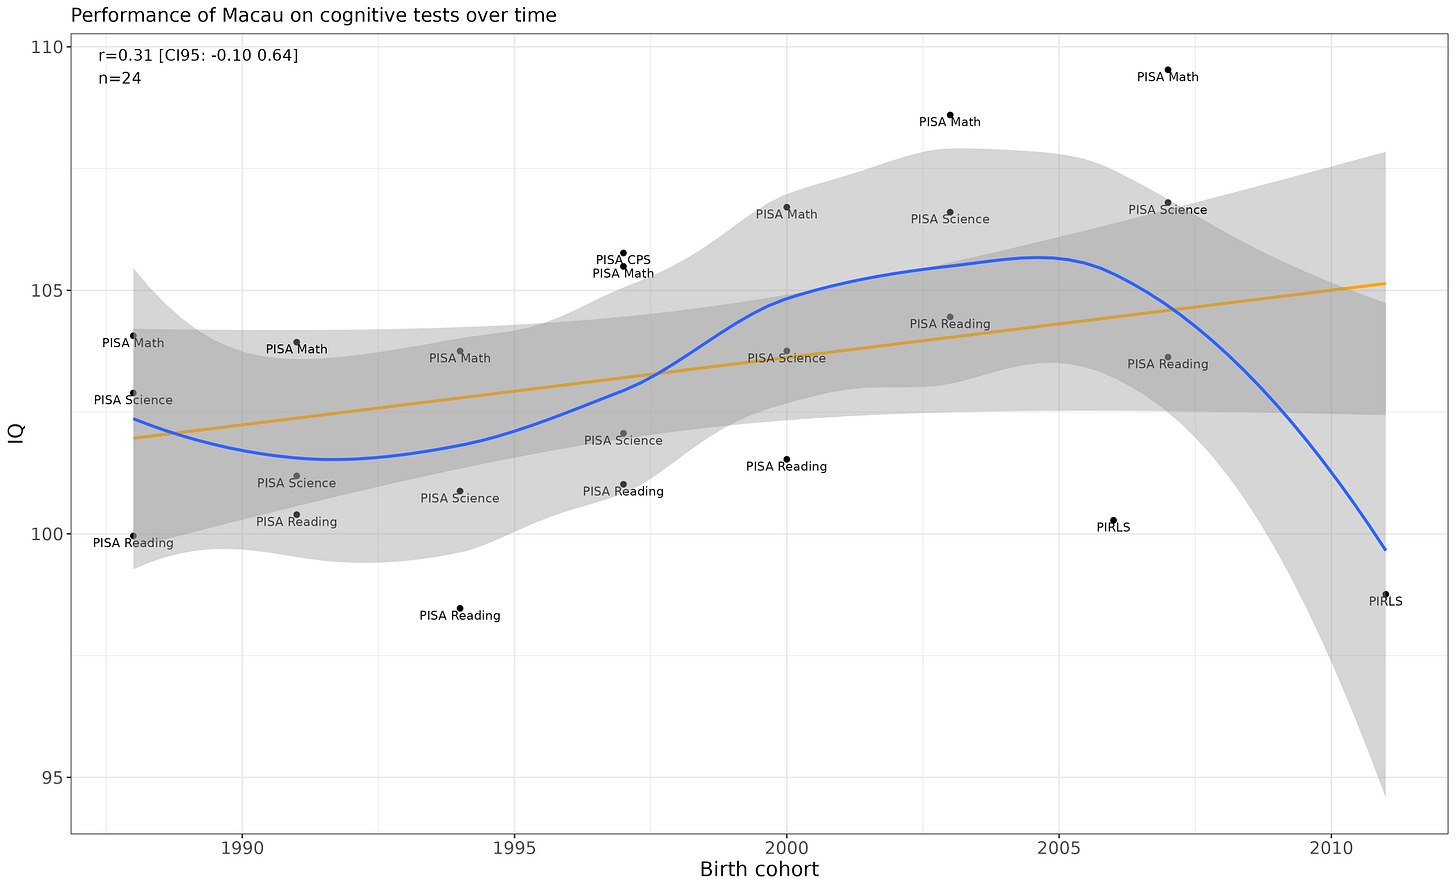
Macau
Appears to be increasing, but the PIRLS outliers are dragging the trendline down.
Removing them reveals a strong upwards trend (p = .0017).
Morocco
Flat. Results are inconsistent within time cohorts.
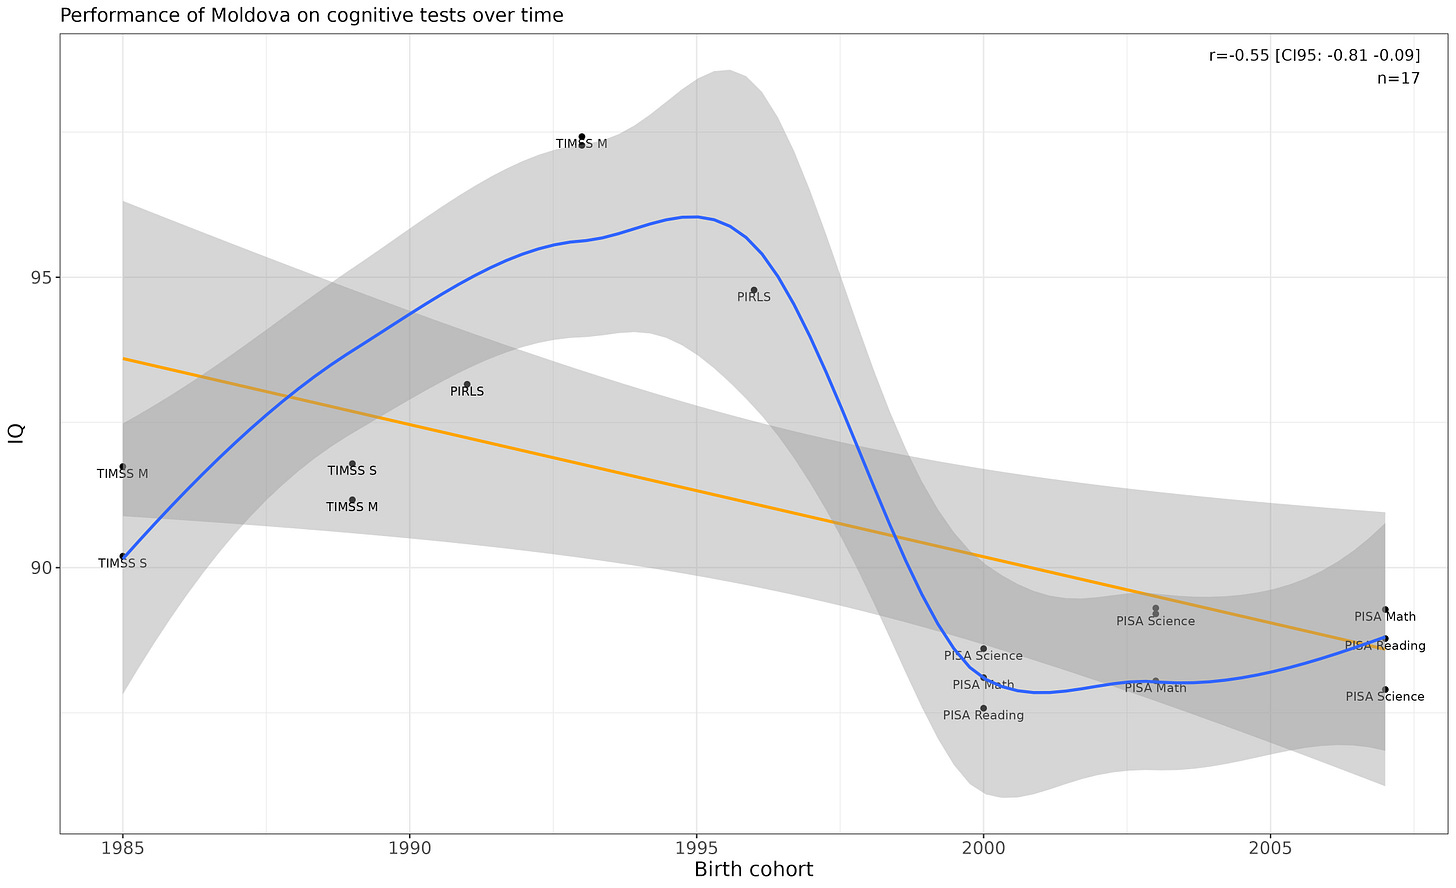
Moldova
The trend is clearly due to a shift from TIMSS/PIRLS testing to PISA testing over time.
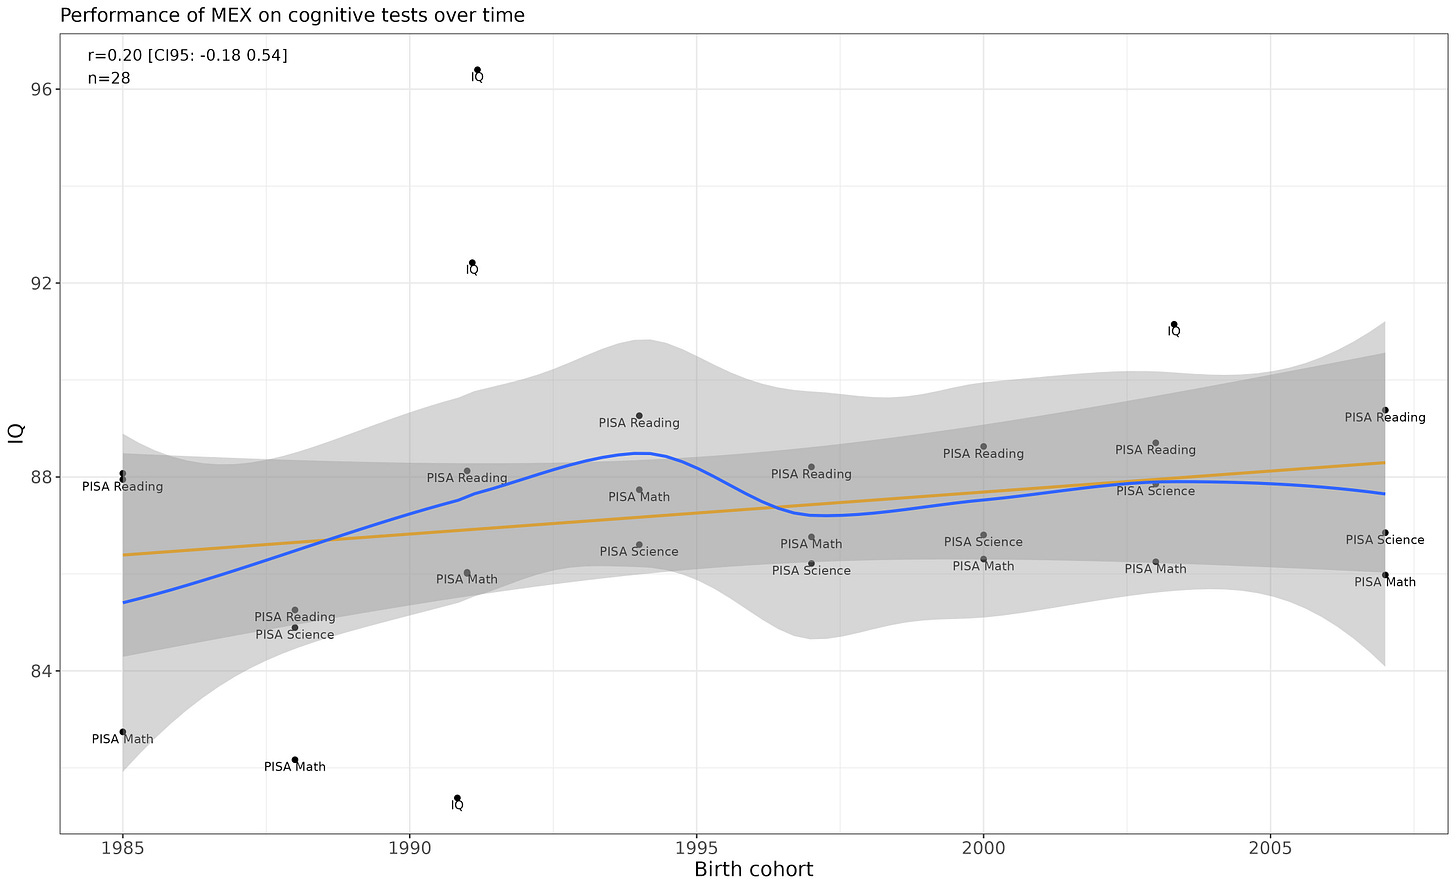
Mexico
Fairly flat performance.
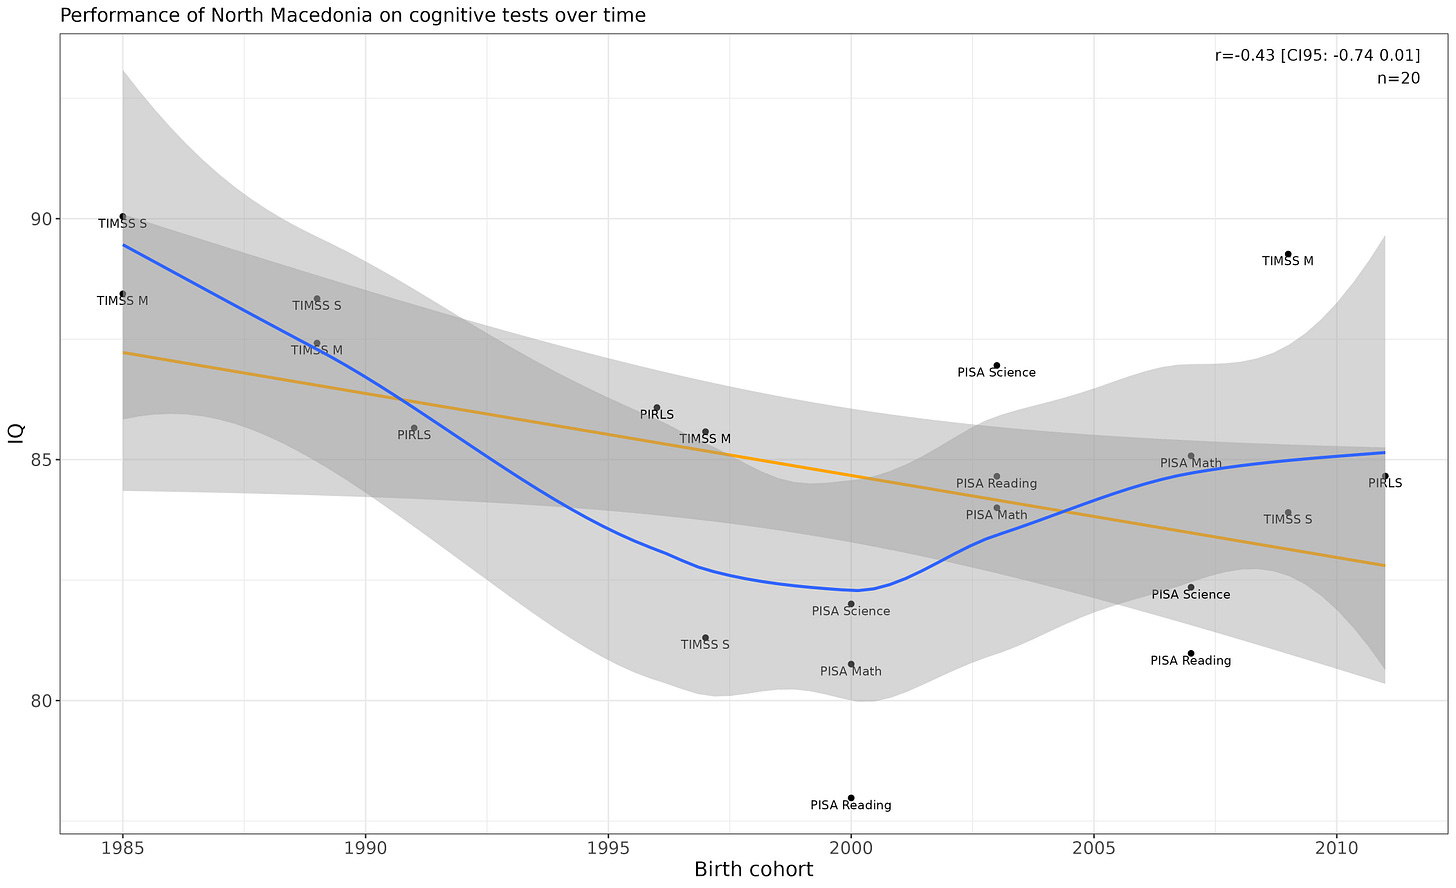
North Macedonia
True ability is probably stagnant. Economist tier p-values.
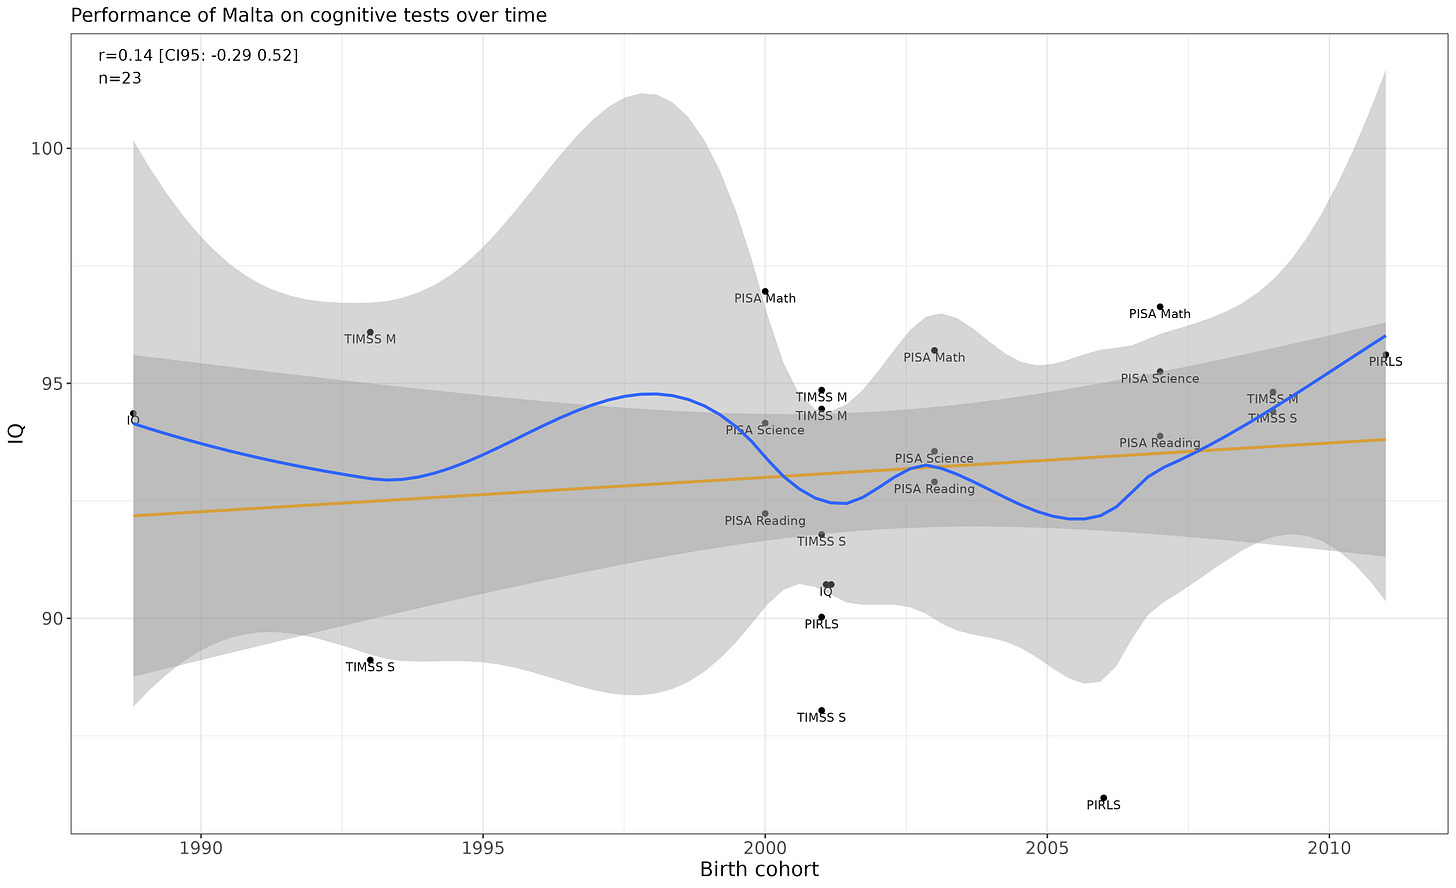
Malta
Flat.
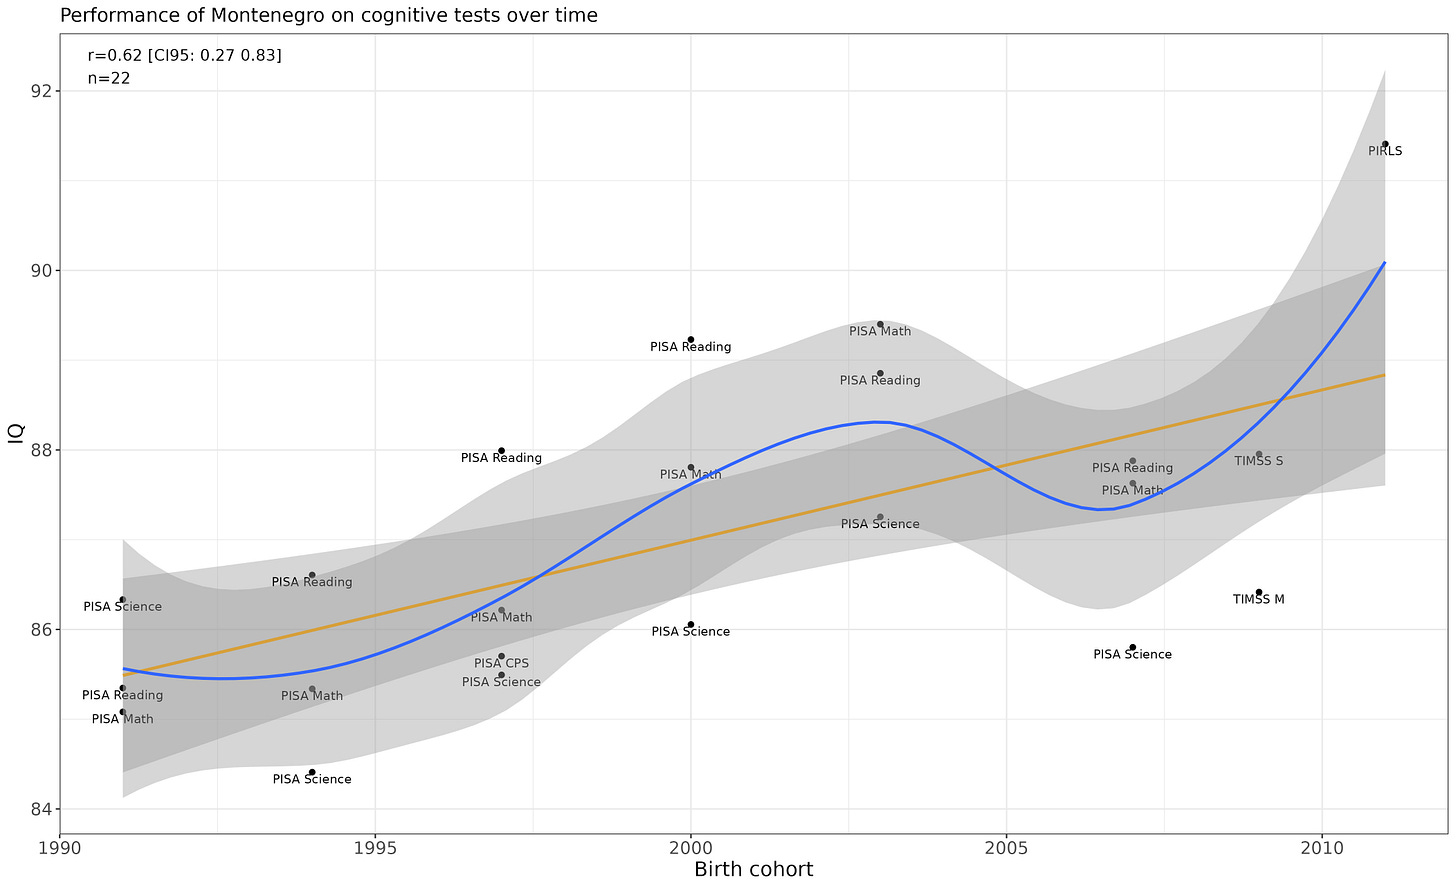
Montenegro
p = .002 for the linear increase. Looks legit.
Malaysia
This looks awful.
Nigeria
Flat.
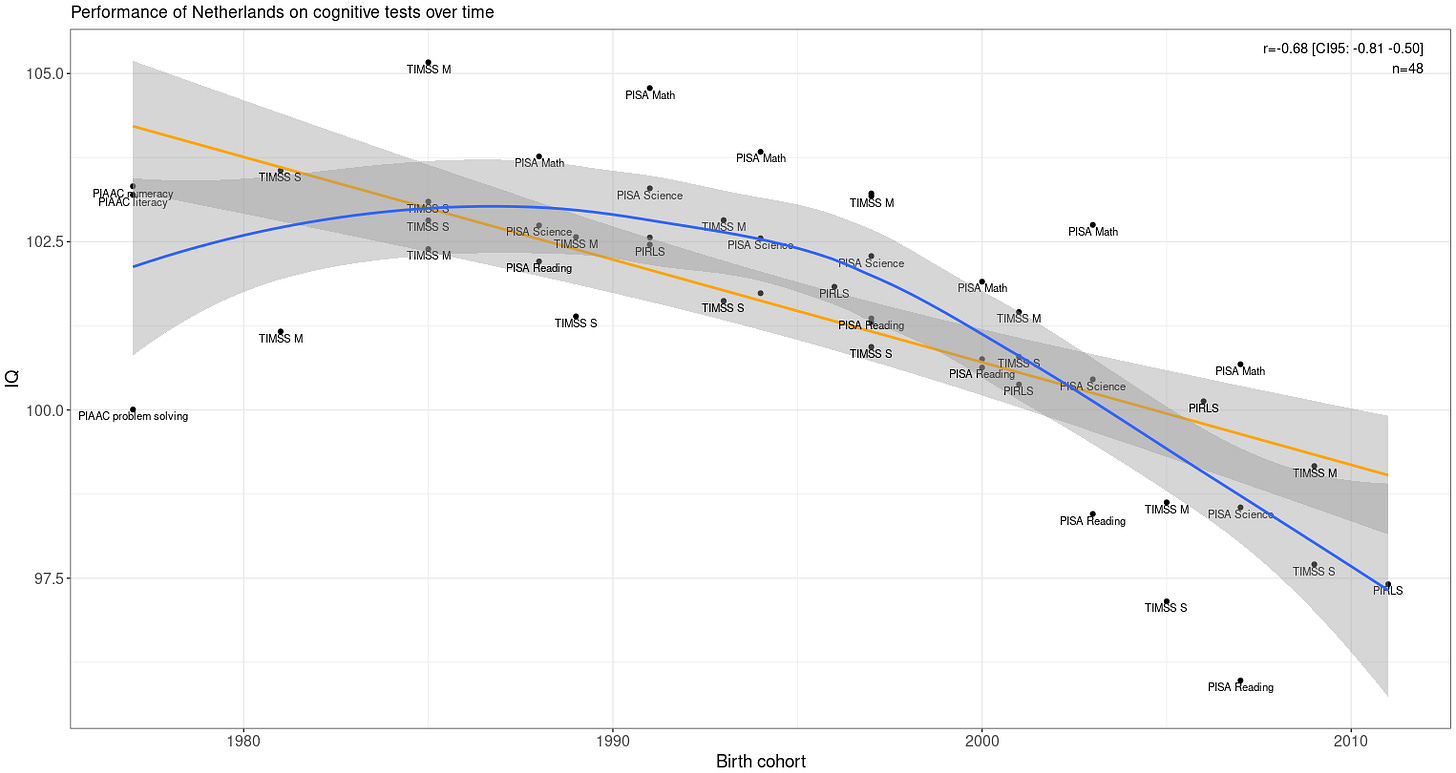
Netherlands
p-values for both the linear (p = .00000008) and non-linear (p = .00013) are clearly robust.
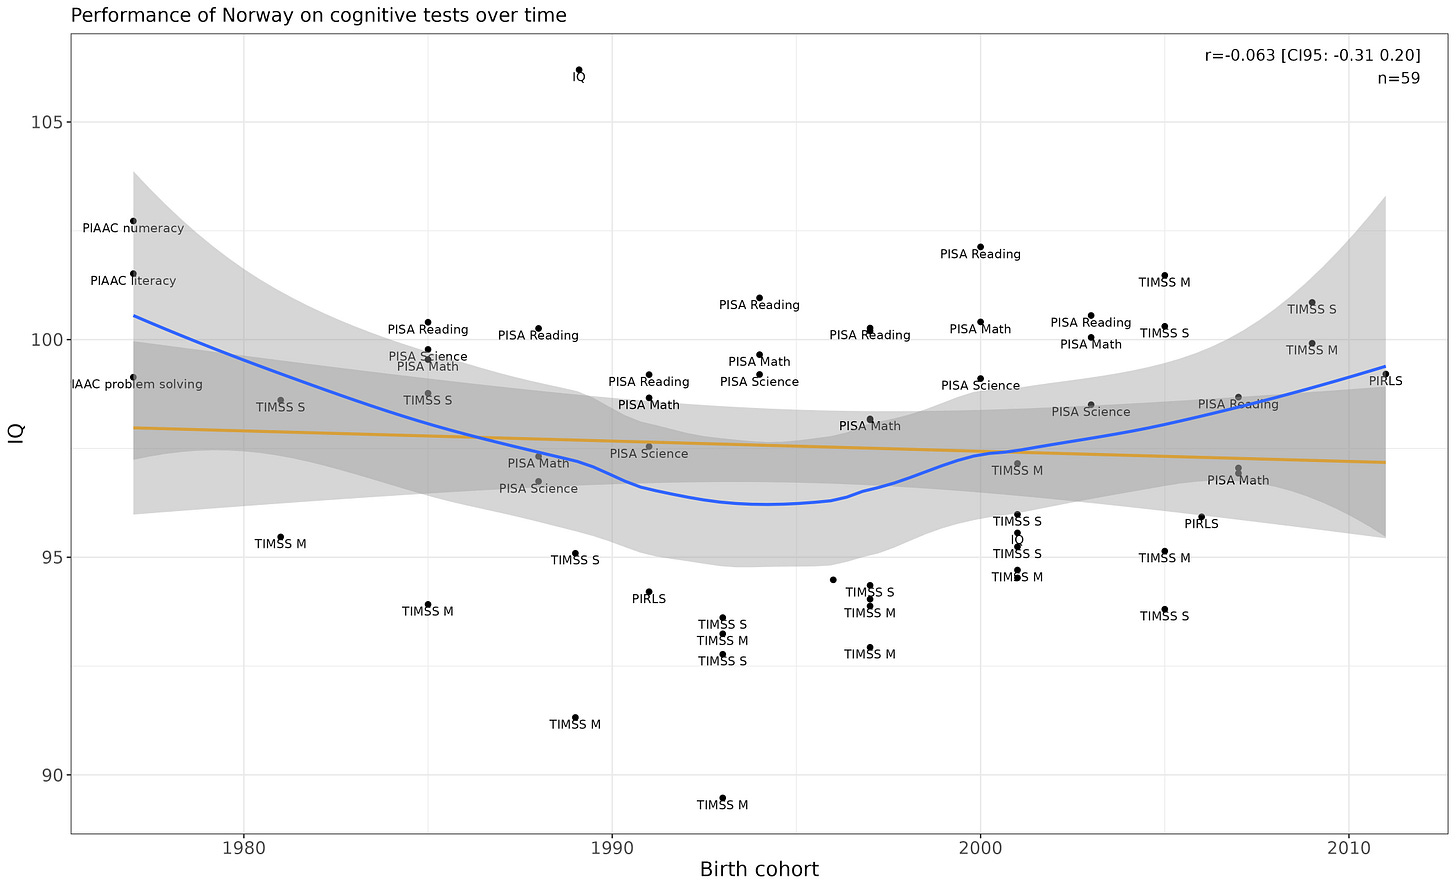
Norway
Flat.
New Zealand
Temporal trend looks unconvincing, p-values are economist tier.
Oman
Flat.
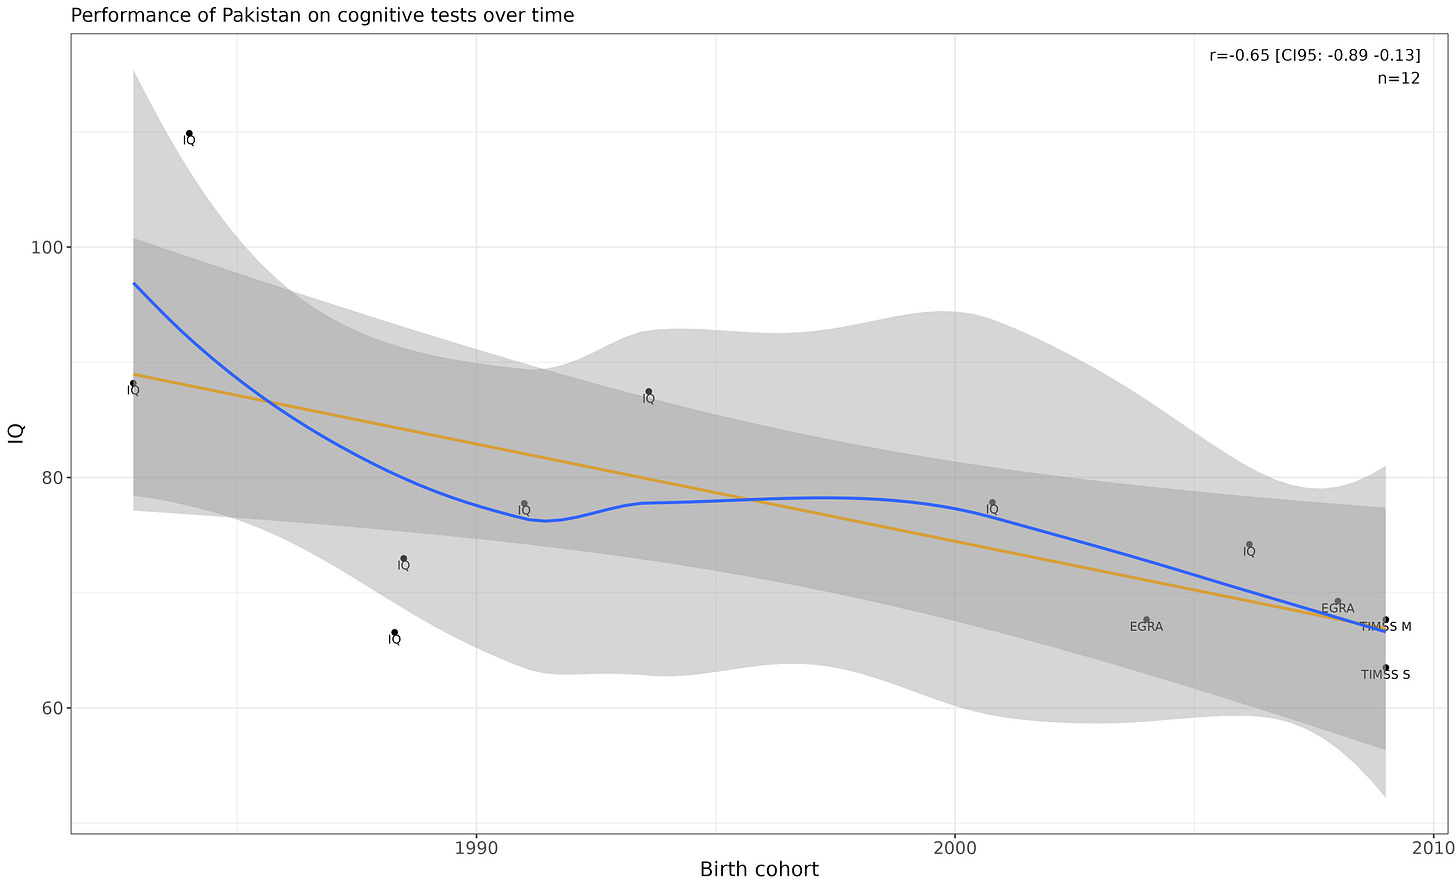
Pakistan
Linear p-value is .021. I don’t trust it as there is too much variance within birth cohorts.
Peru
Fairly robust increase. Linear p-value is p = .00000016.
Philippines
Looks like the true trend is flat, but the results are inconsistent so the model picks up on weird variance.
Poland
Weak increase. Linear trend is p =.008.
Puerto Rico
Results are too inconsistent within years to judge, but I suspect a flat trend.
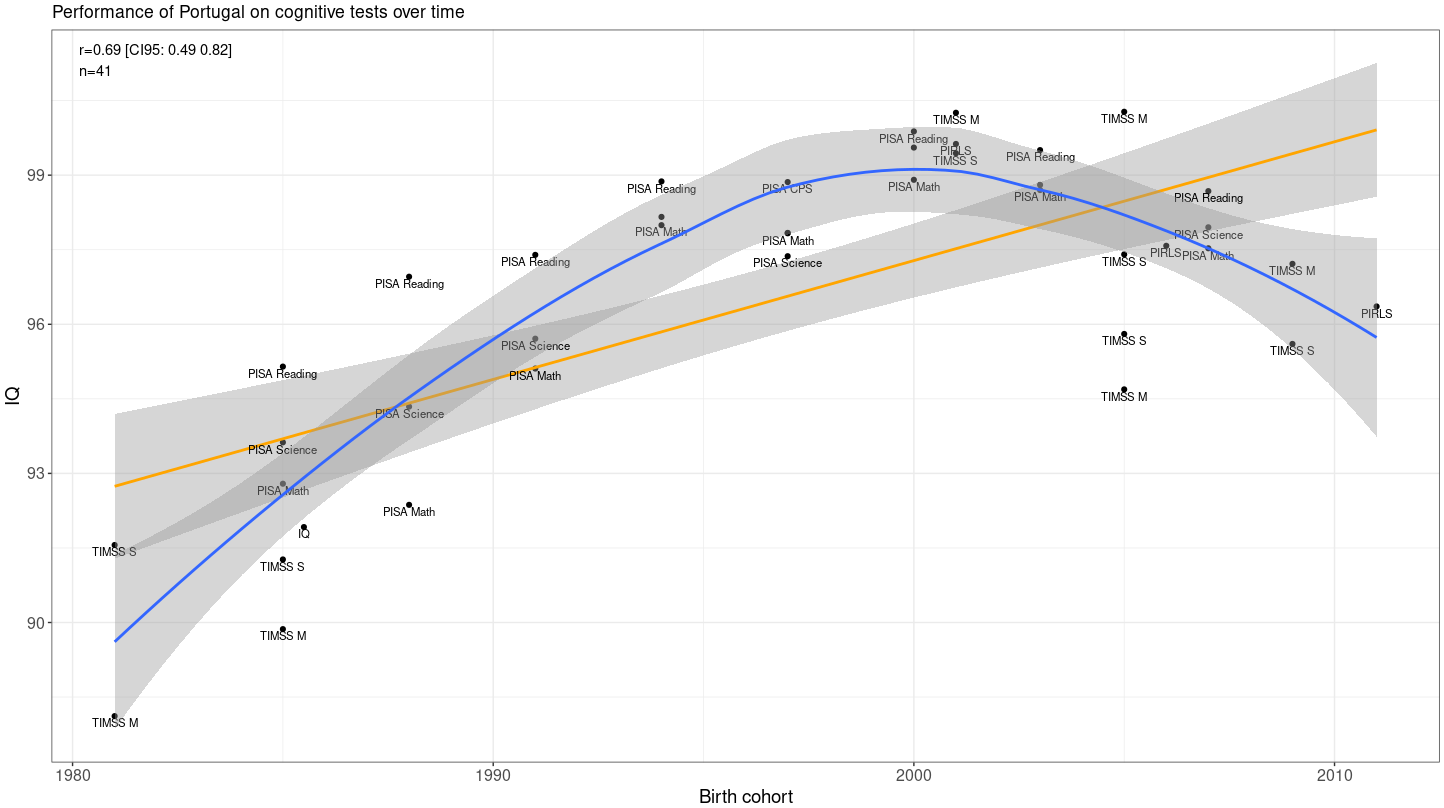
Portugal
Congratulations to Portugal for having the most consistent cognitive testing results.
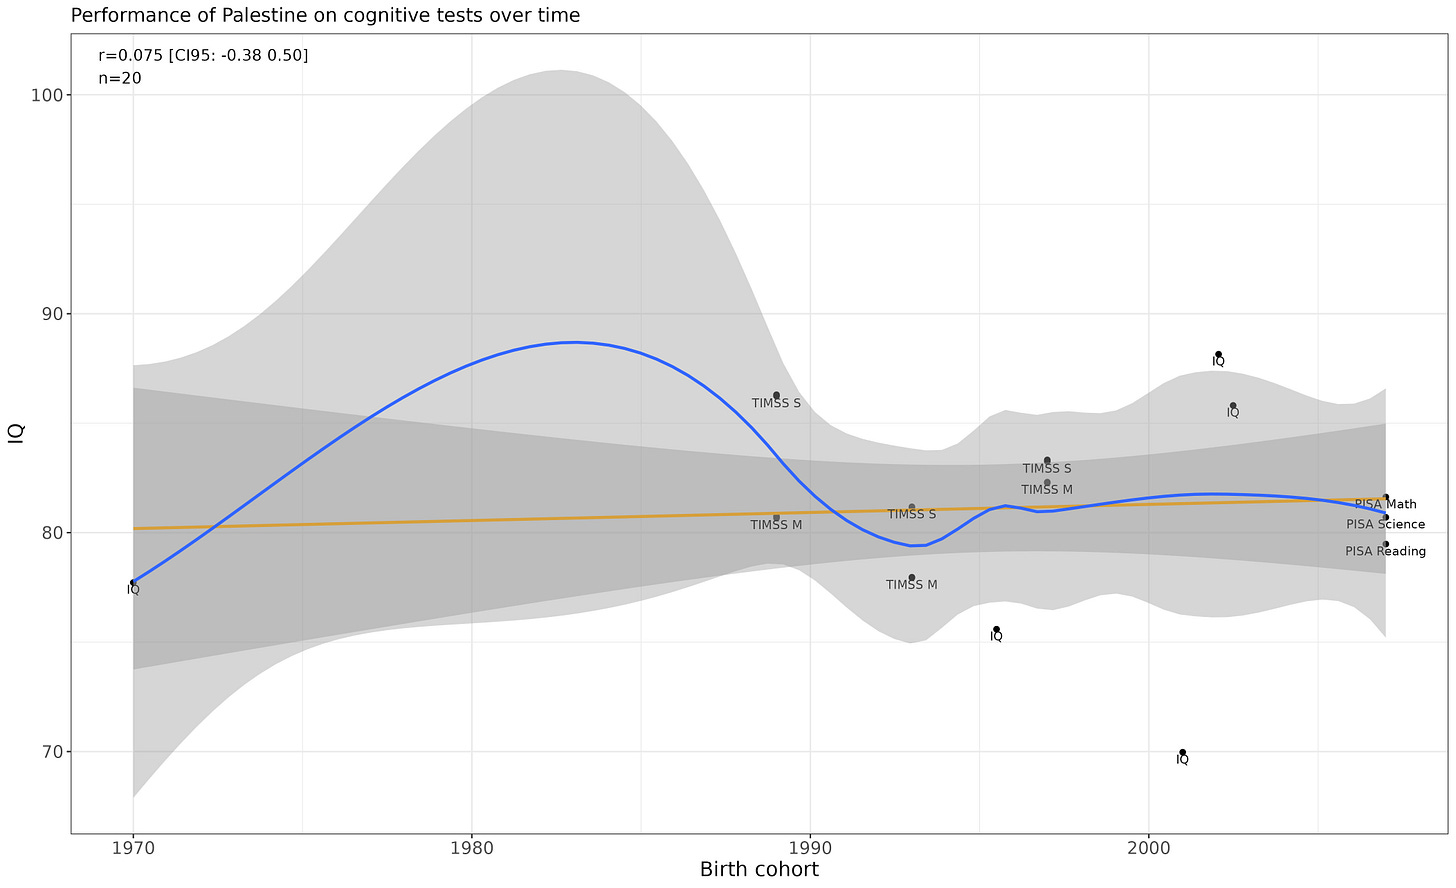
Palestine
Awkward chart, but trend looks flat.
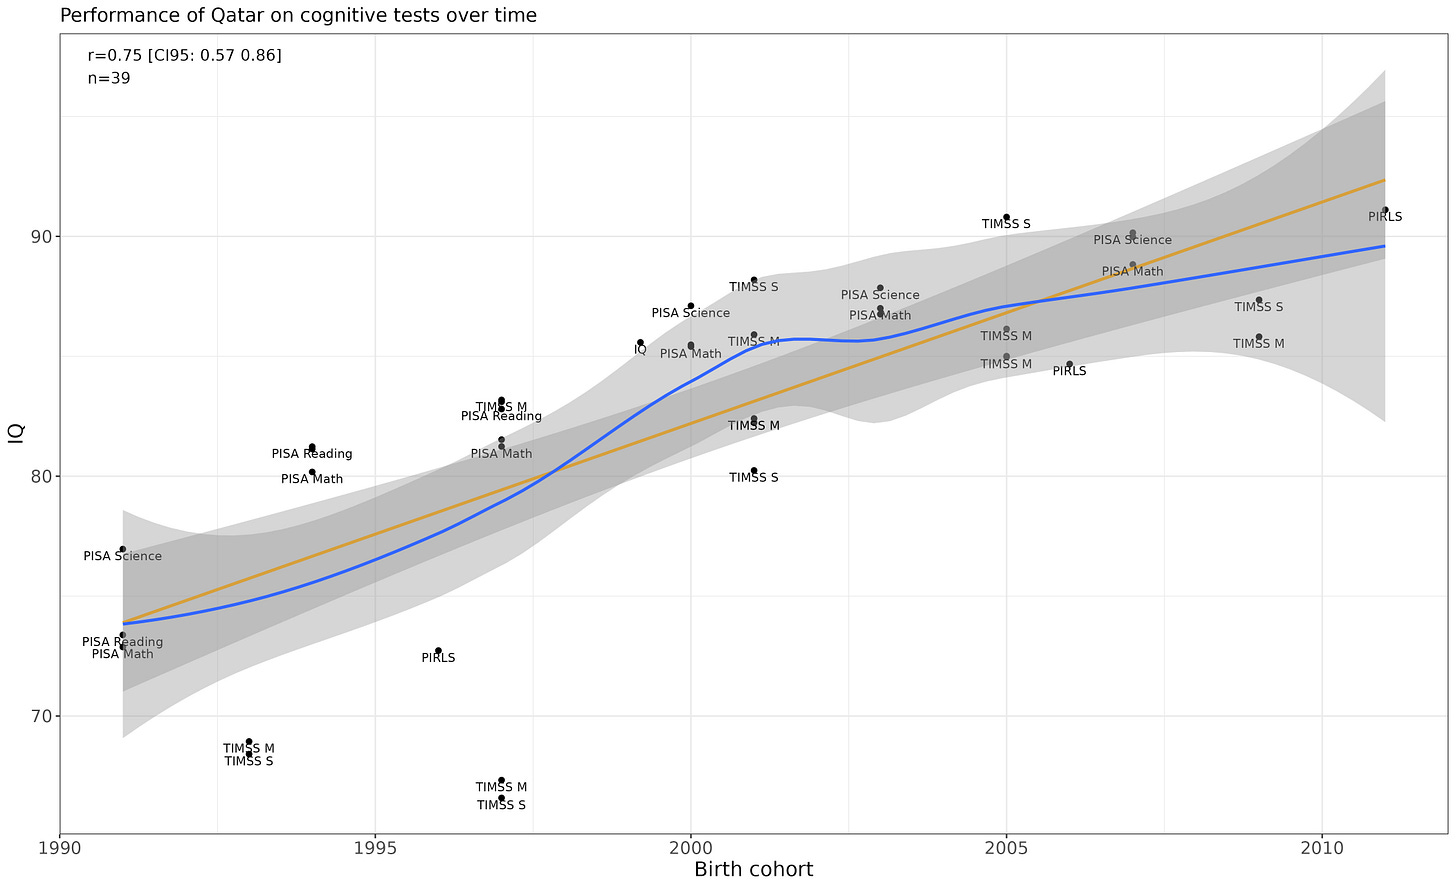
Qatar
p-value for the linear trend is p = .00000004.
Romania
No temporal trend. Based on the results of my dysgenic fertility study, Romanian IQ should be decreasing by about .65 points per decade, but there is no trend in scores at all. I suspect that the results for Romania from my study are wrong, or there is an environmental trend going in the opposite direction that is keeping the Romanian IQ high.
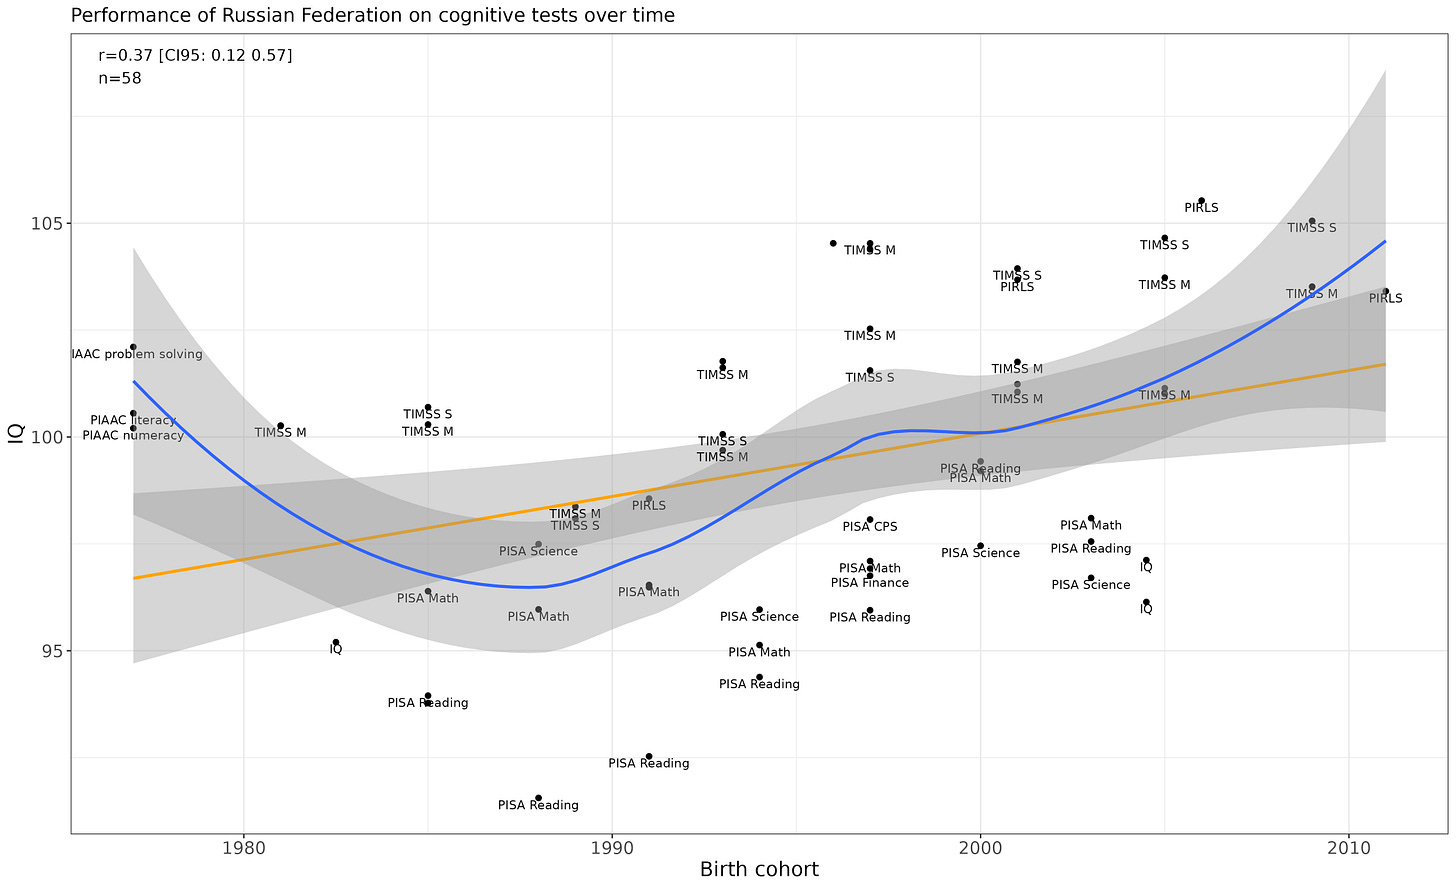
Russia
Statistically, the rise is robust (p = .005 for the linear trend, .0031 for the non-linear trend).
Saudi Arabia
I’m on the fence about this one. Theoretically, intelligence should have risen due to economic development, but the linear p-value is unconvincing (p = .016).
Scotland
Flat.
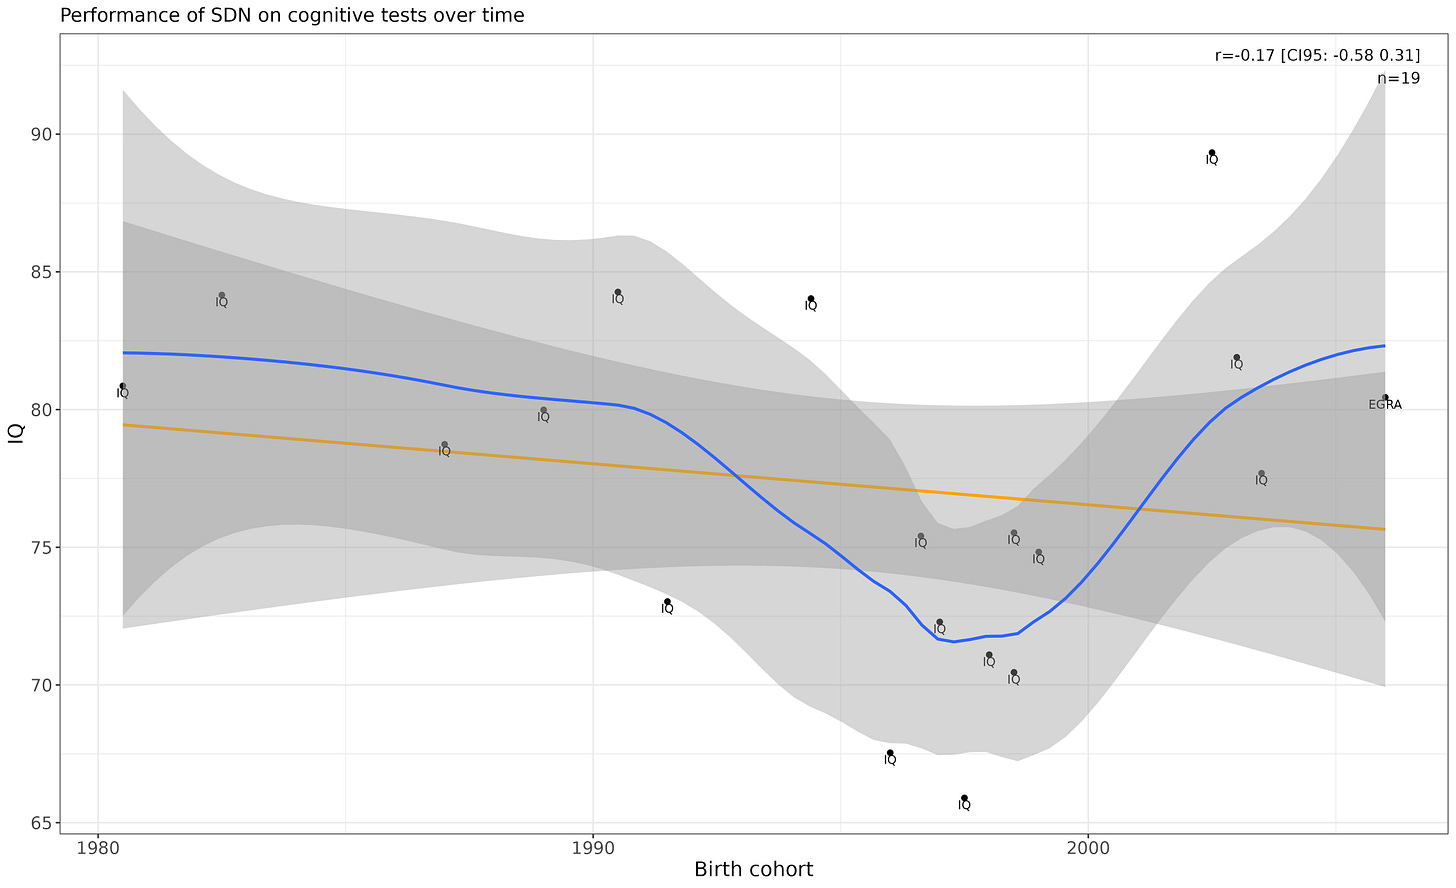
Sudan
Non-linear p-value is unconvincing, just .033.
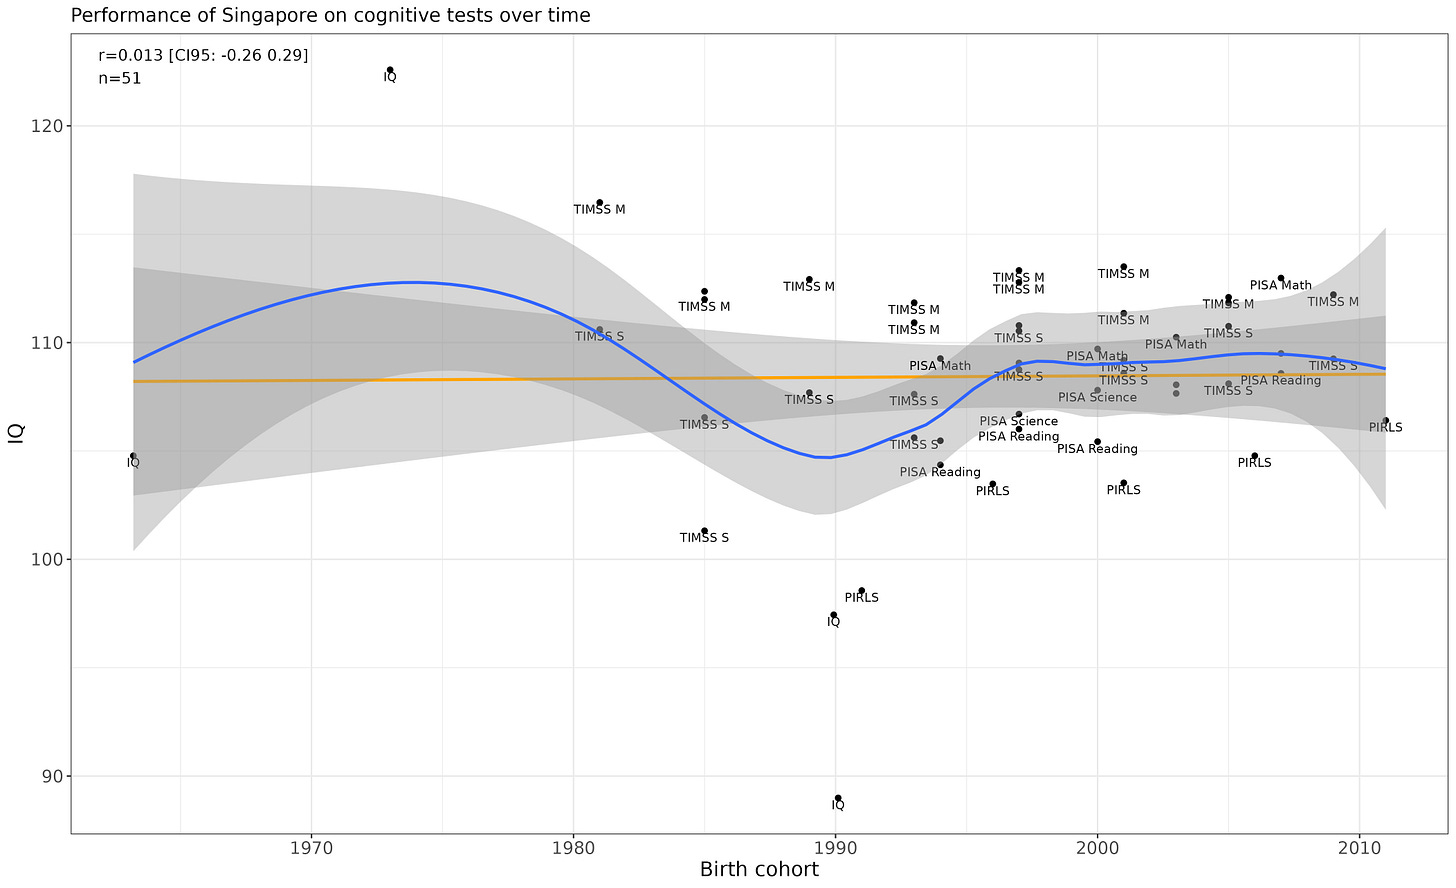
Singapore
Flat.
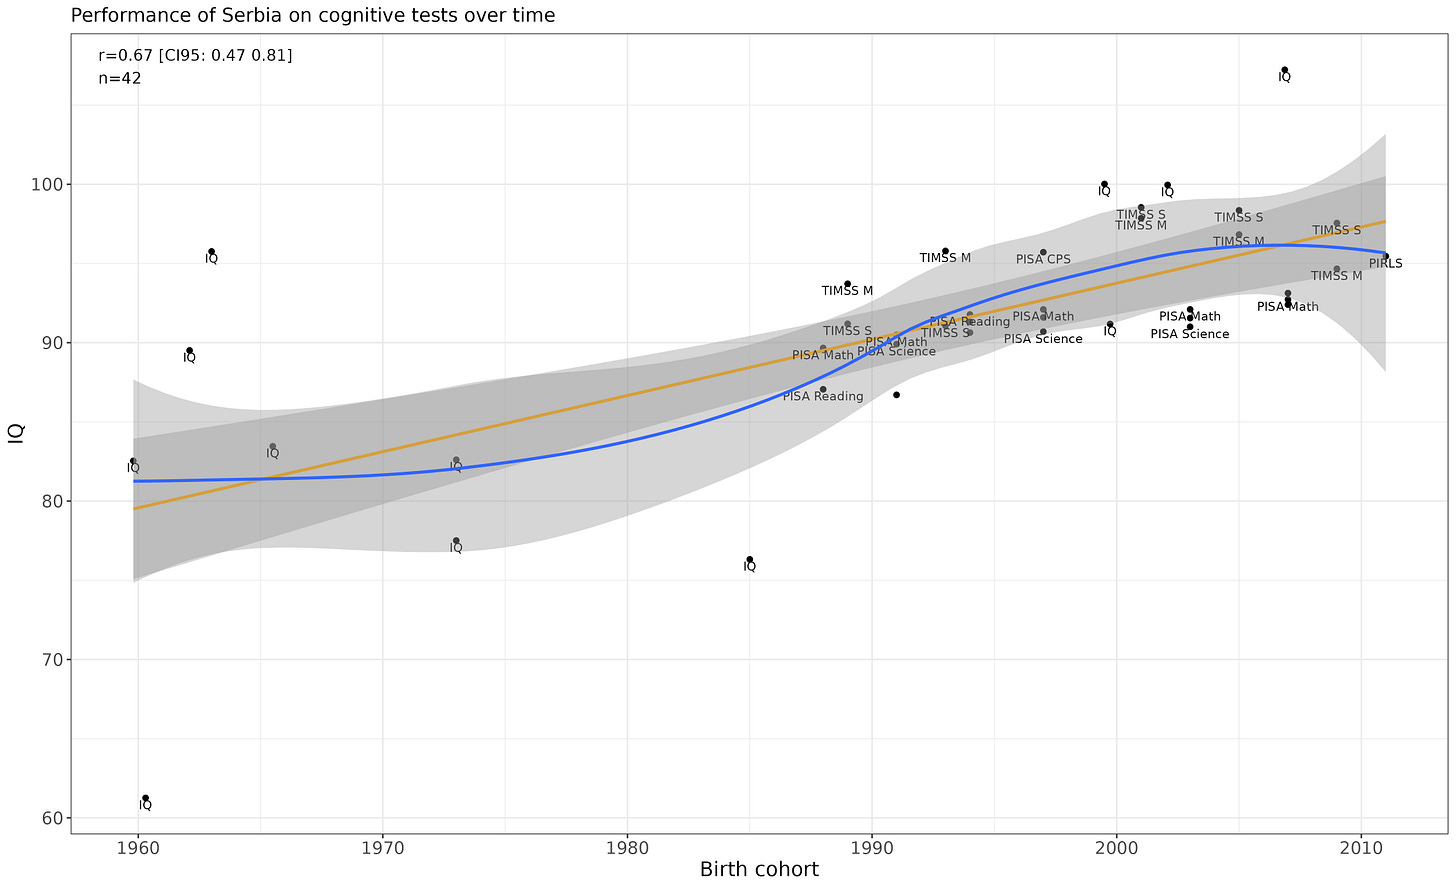
Serbia
Linear p-value is convincing (p = .00000098).
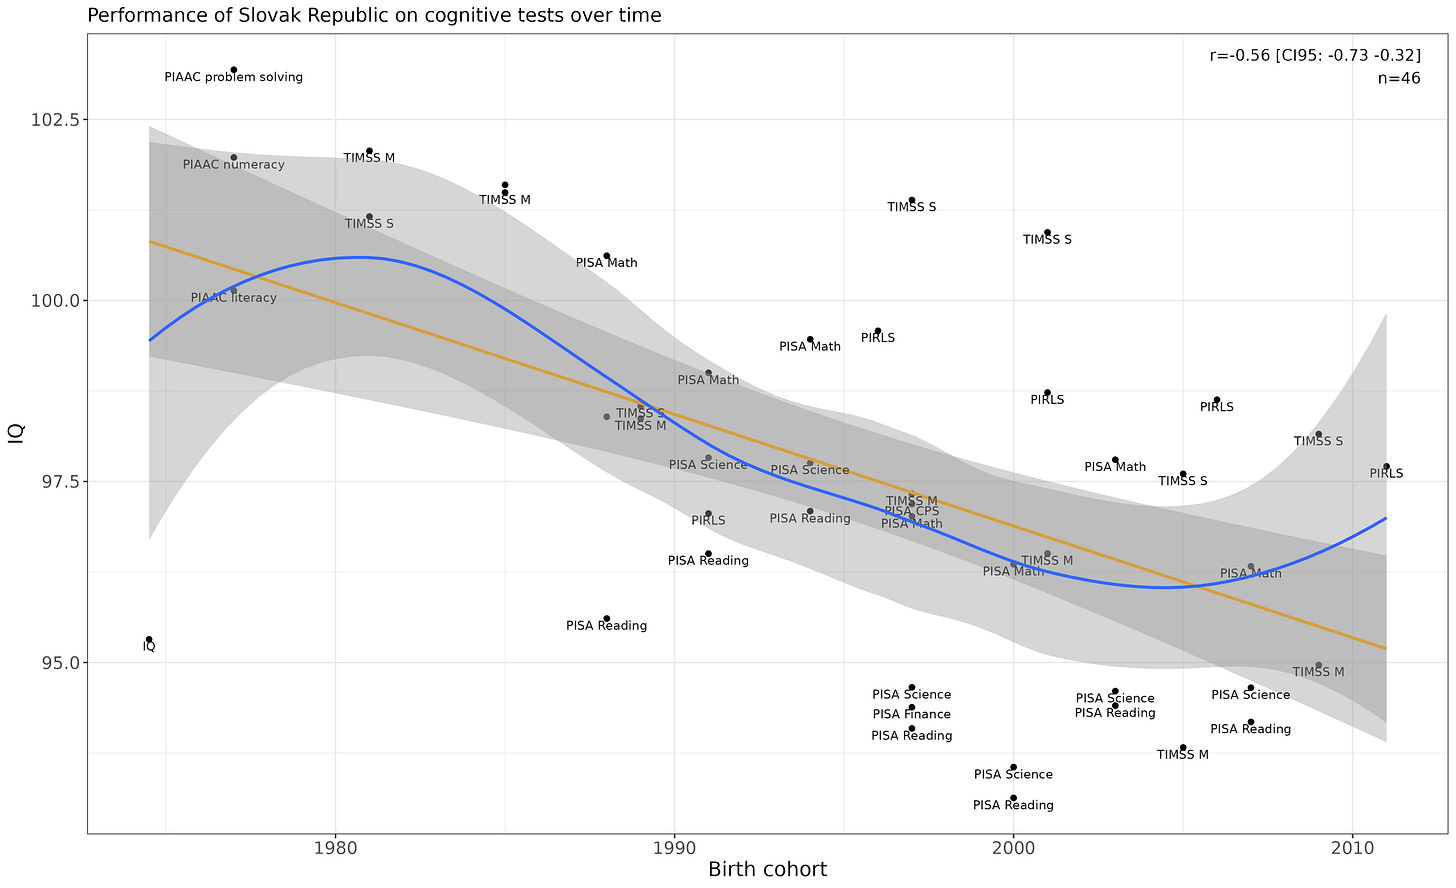
Slovak Republic
Clear decline (linear p-value is .00006).
Slovenia
Flat.
Sweden
A small decline that barely passes statistical significance (p = .04). Apparently they systematically removed immigrants from the most recent PISA testing wave, so I’m inclined to believe that there is a true decline.
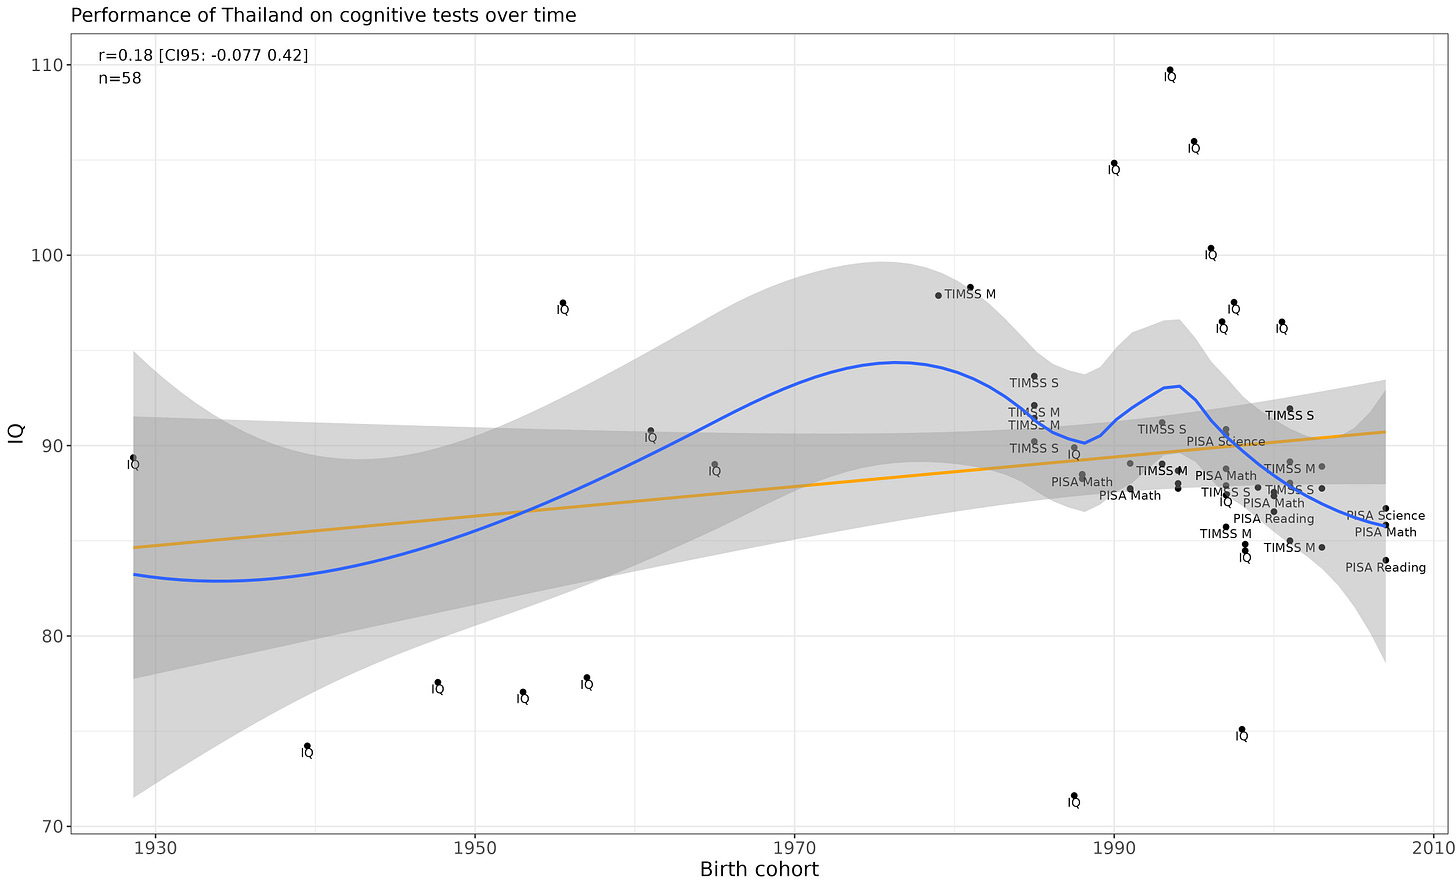
Thailand
…Let me fix that.
Decline is more robust after removing the IQ test score results.
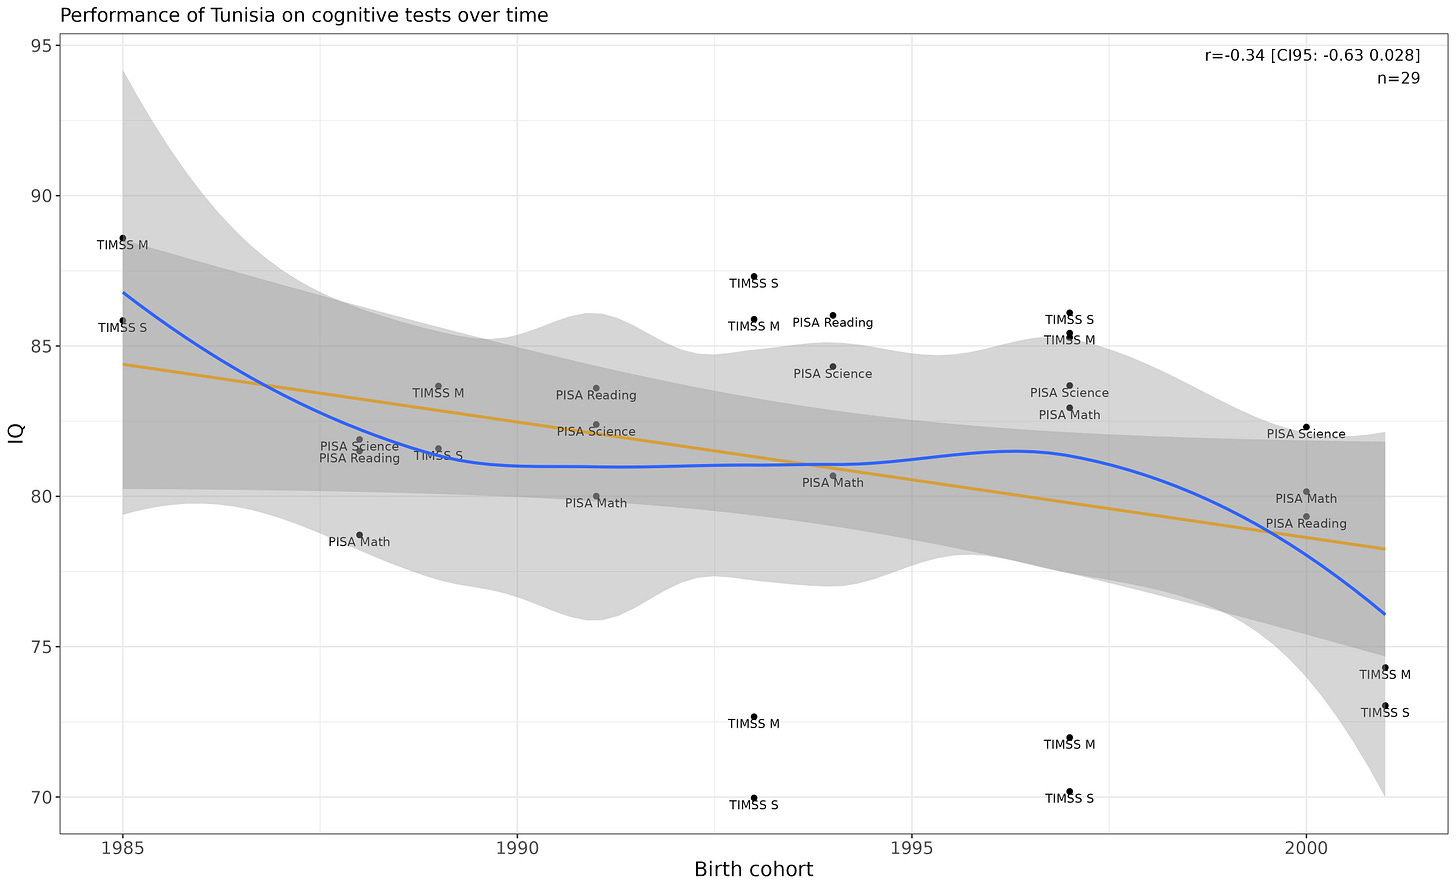
Tunisia
Economist tier linear p-value (p = .07). Wouldn’t put stock into it.
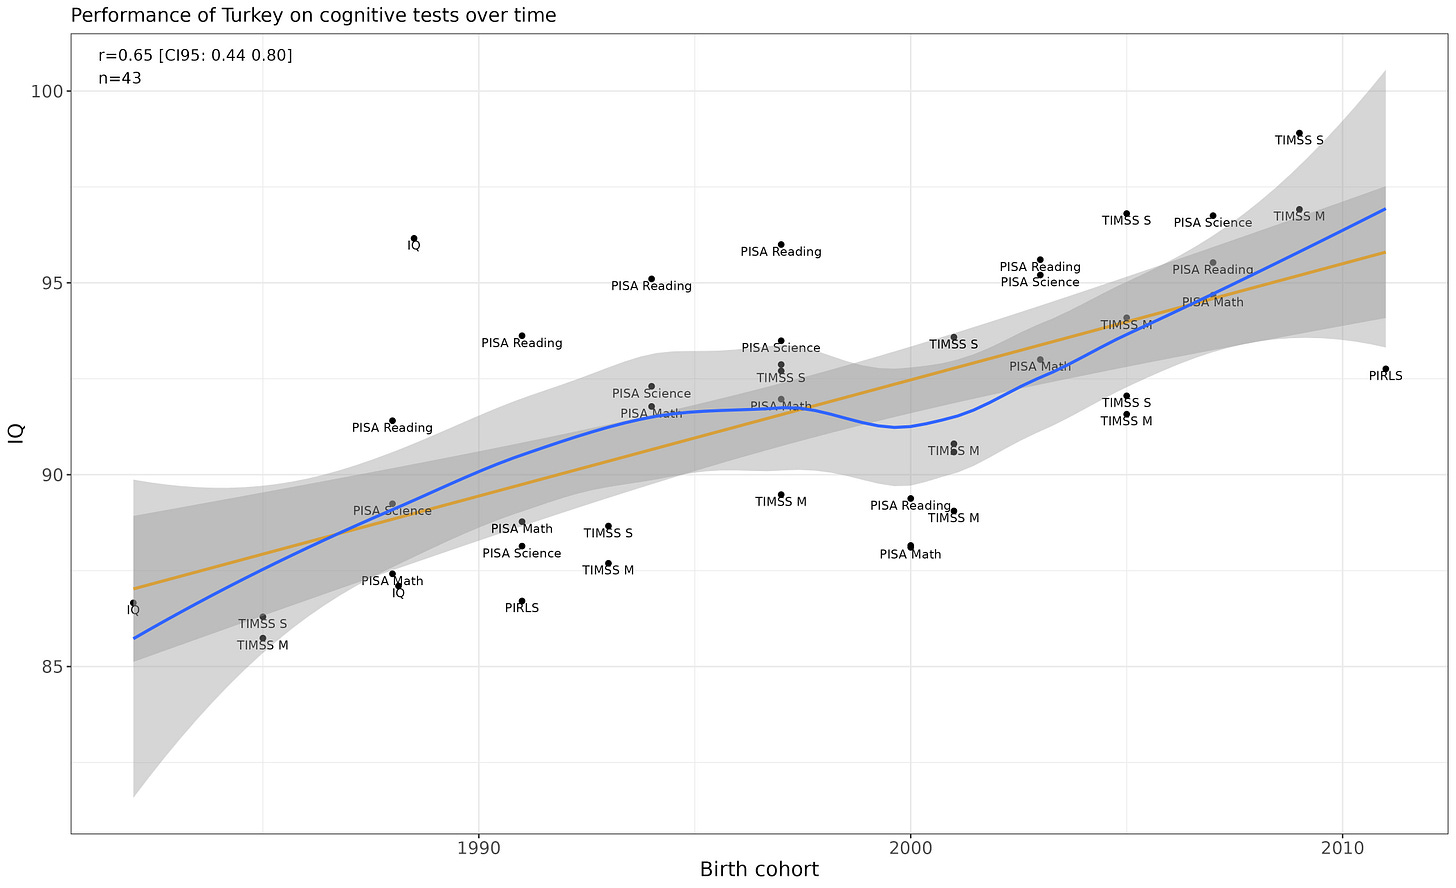
Turkey
Linear p-value is p = .000002.
Taiwan
Flat.
Tanzania
Flat.
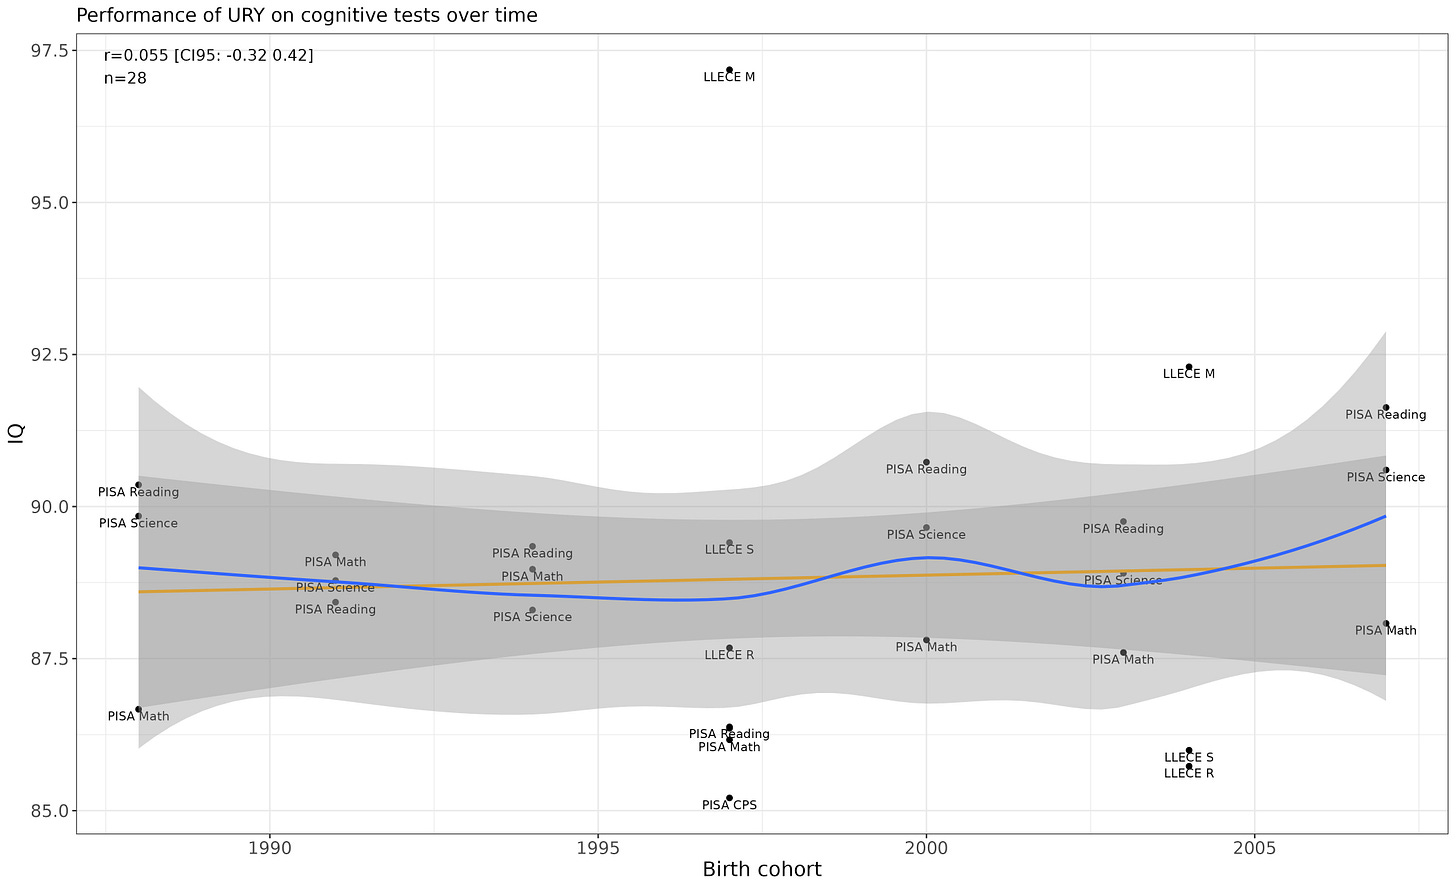
Uruguay
Flat.
United States
Flat.
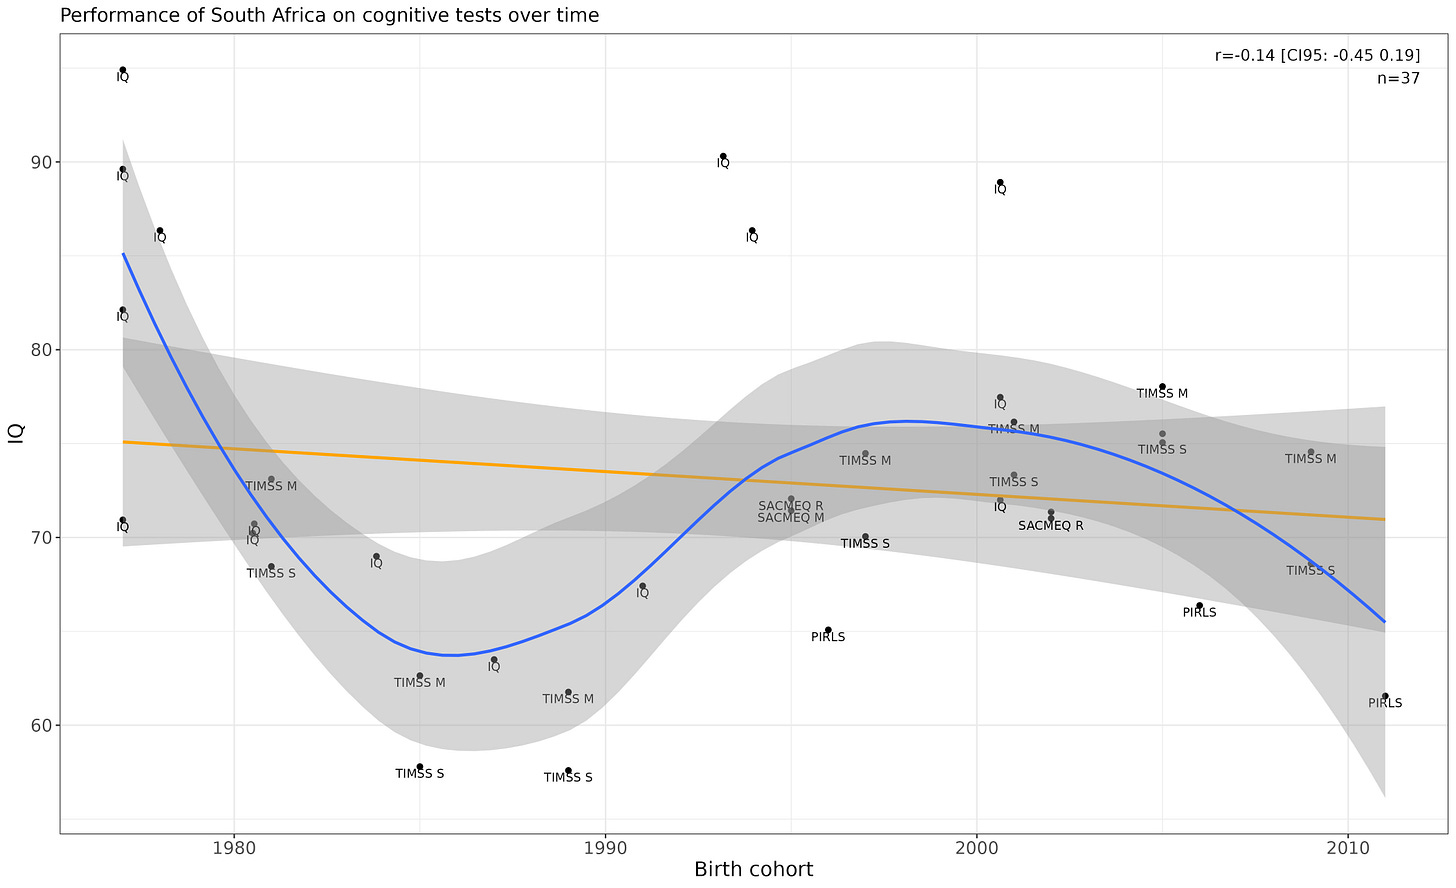
South Africa
Normally I would throw out a weird non-linear result like this, but it appears in both the IQ samples and the TIMSS samples, which makes me think that it might be legit. The p-value is pretty good (p = .000086 for the nonlinear model in comparison to the linear model).
Ukraine
No time trend (at the request of Ubersoy).
Sub-Saharan Africa
In all tests:
Because the PASEC and SACMEQ tests are normalized within Africa, they are uninformative for observing differences across time. Because of that, they should be removed. Doing that produces this result:
The average increases by 2 points, and the decrease is no longer observed.
Certain datasets are not biased agaisnt, Sub-Saharan Africa, as the average IQ is roughly 70 regardless of whatever source is consulted.
h/t:
Becker for the IQ scores
Justin Malloy for his reviews of the national IQs of several countries (including Vietnam, Laos, the Cayman Islands)
Warne for his meta-analysis on the Irish IQ. Note: I only included samples that were tested within Ireland.




























































Why no Bangladesh here?
Another remark; the TIMSS SDs do not seem to be the same size as the PISA ones. Thus Japan is far below 108 and Pakistan and the Philippines are far above 65.