

Question 1
From gwern, regarding differences in intelligence between Chinese provinces:
How much would the smaller urban numbers like the Beijing/Shanghai numbers be distorted by the fact that an official Chinese government study like the CFPS (run by the China Social Science Survey Center at Peking University) presumably only samples residents with hukous officially registered to the city, and omits the rest of the less elite population that actually live there?
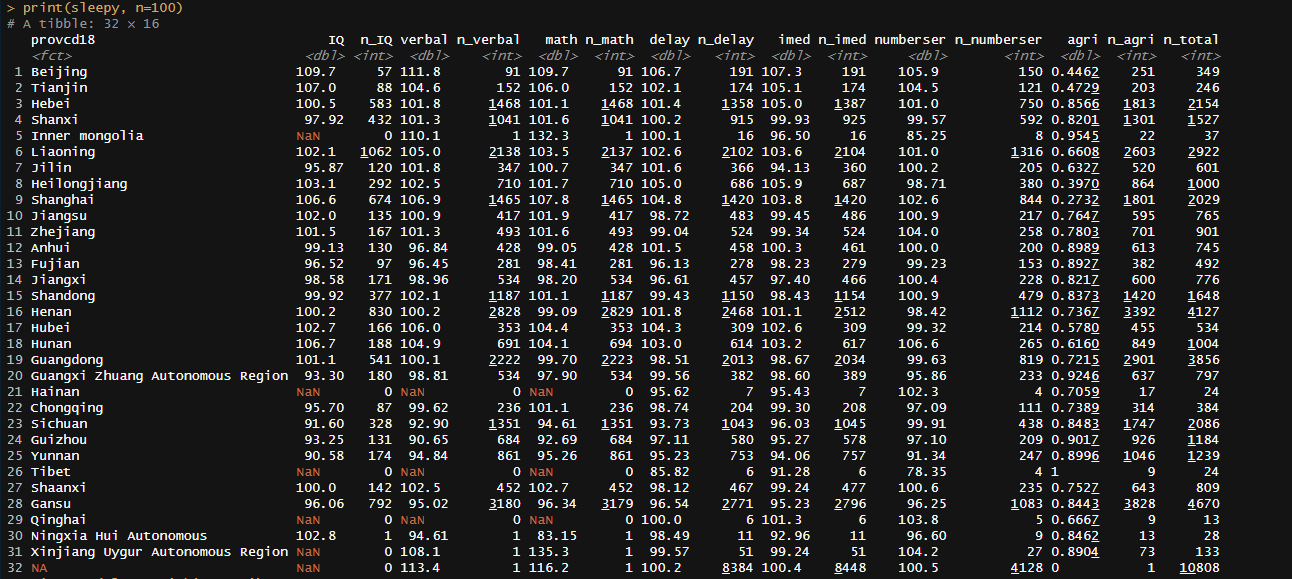
I can do a better job of calculating the IQ differences between Chinese provinces now, and so went back to the CFPS and downloaded the CFPS data from 2012 and 2018 to calculate the average IQ by province.
These are the province averages for the 5 tests: math, verbal, delayed word recall, immediate word recall, number series, and the first principal component of the five tests:
Information on the subject’s hukou status was extracted from variable qa301 in the 2018 dataset, and I separated the subjects into two groups: agricultural and non-agricultural. On average, 27% of the subjects in Shanghai and 44% of the subjects in Beijing still had agricultural hukous in 2018, so it seems that the CFPS did sample individuals who did not have the right hukou status. I have no idea what the true percentage of people in Chinese cities who do not hold hukou permits is, though this bias would only distort the province averages if non-representative sampling for hukou differed by province. My guess is that it does, though it’s difficult to quantify the degree to which this is the case.
The average difference in intelligence between people who had agricultural and non-agricultural hukous in Shanghai and Beijing was small, which leads me to believe that it’s not that much of an issue.

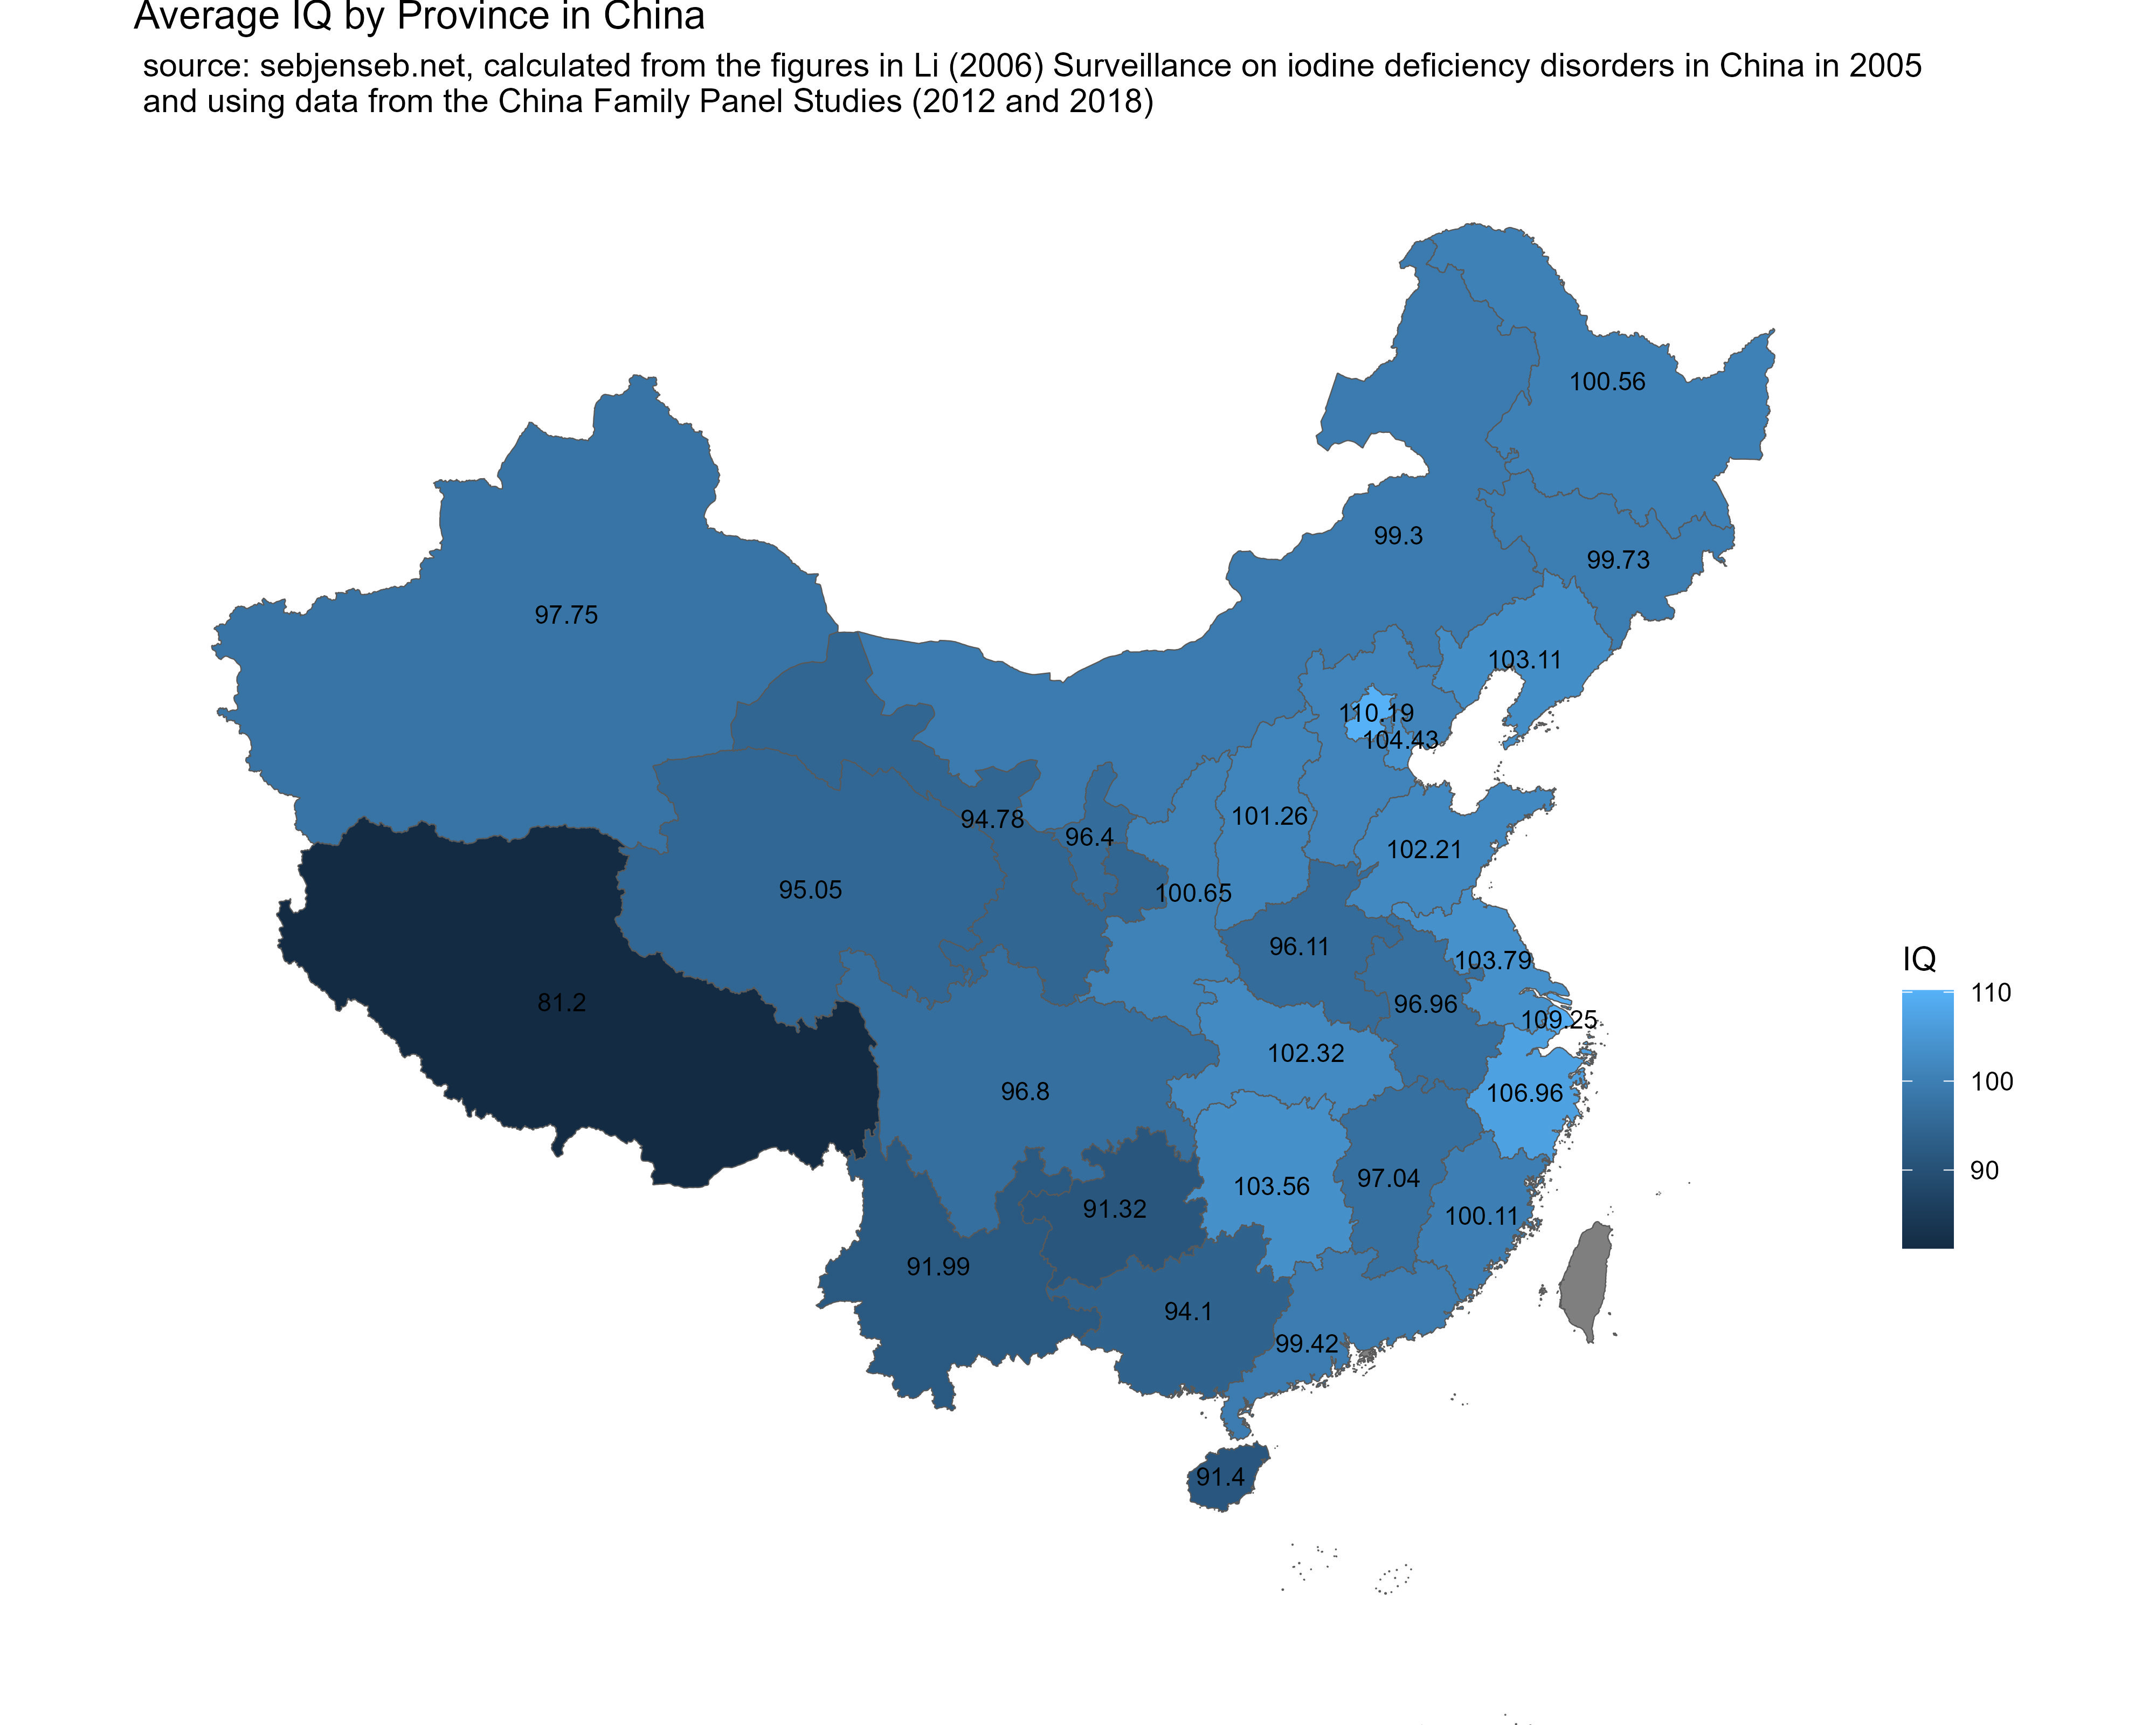
I combined the averages calculated from the CFPS with those that were observed in the Chinese iodine study. The correlation between the sources in regional IQs was 0.54 — rather disappointing. If an overall average could not be computed for a province in the CFPS, I took the average of the subtest averages weighed by the number of samples that were available. These were the results:
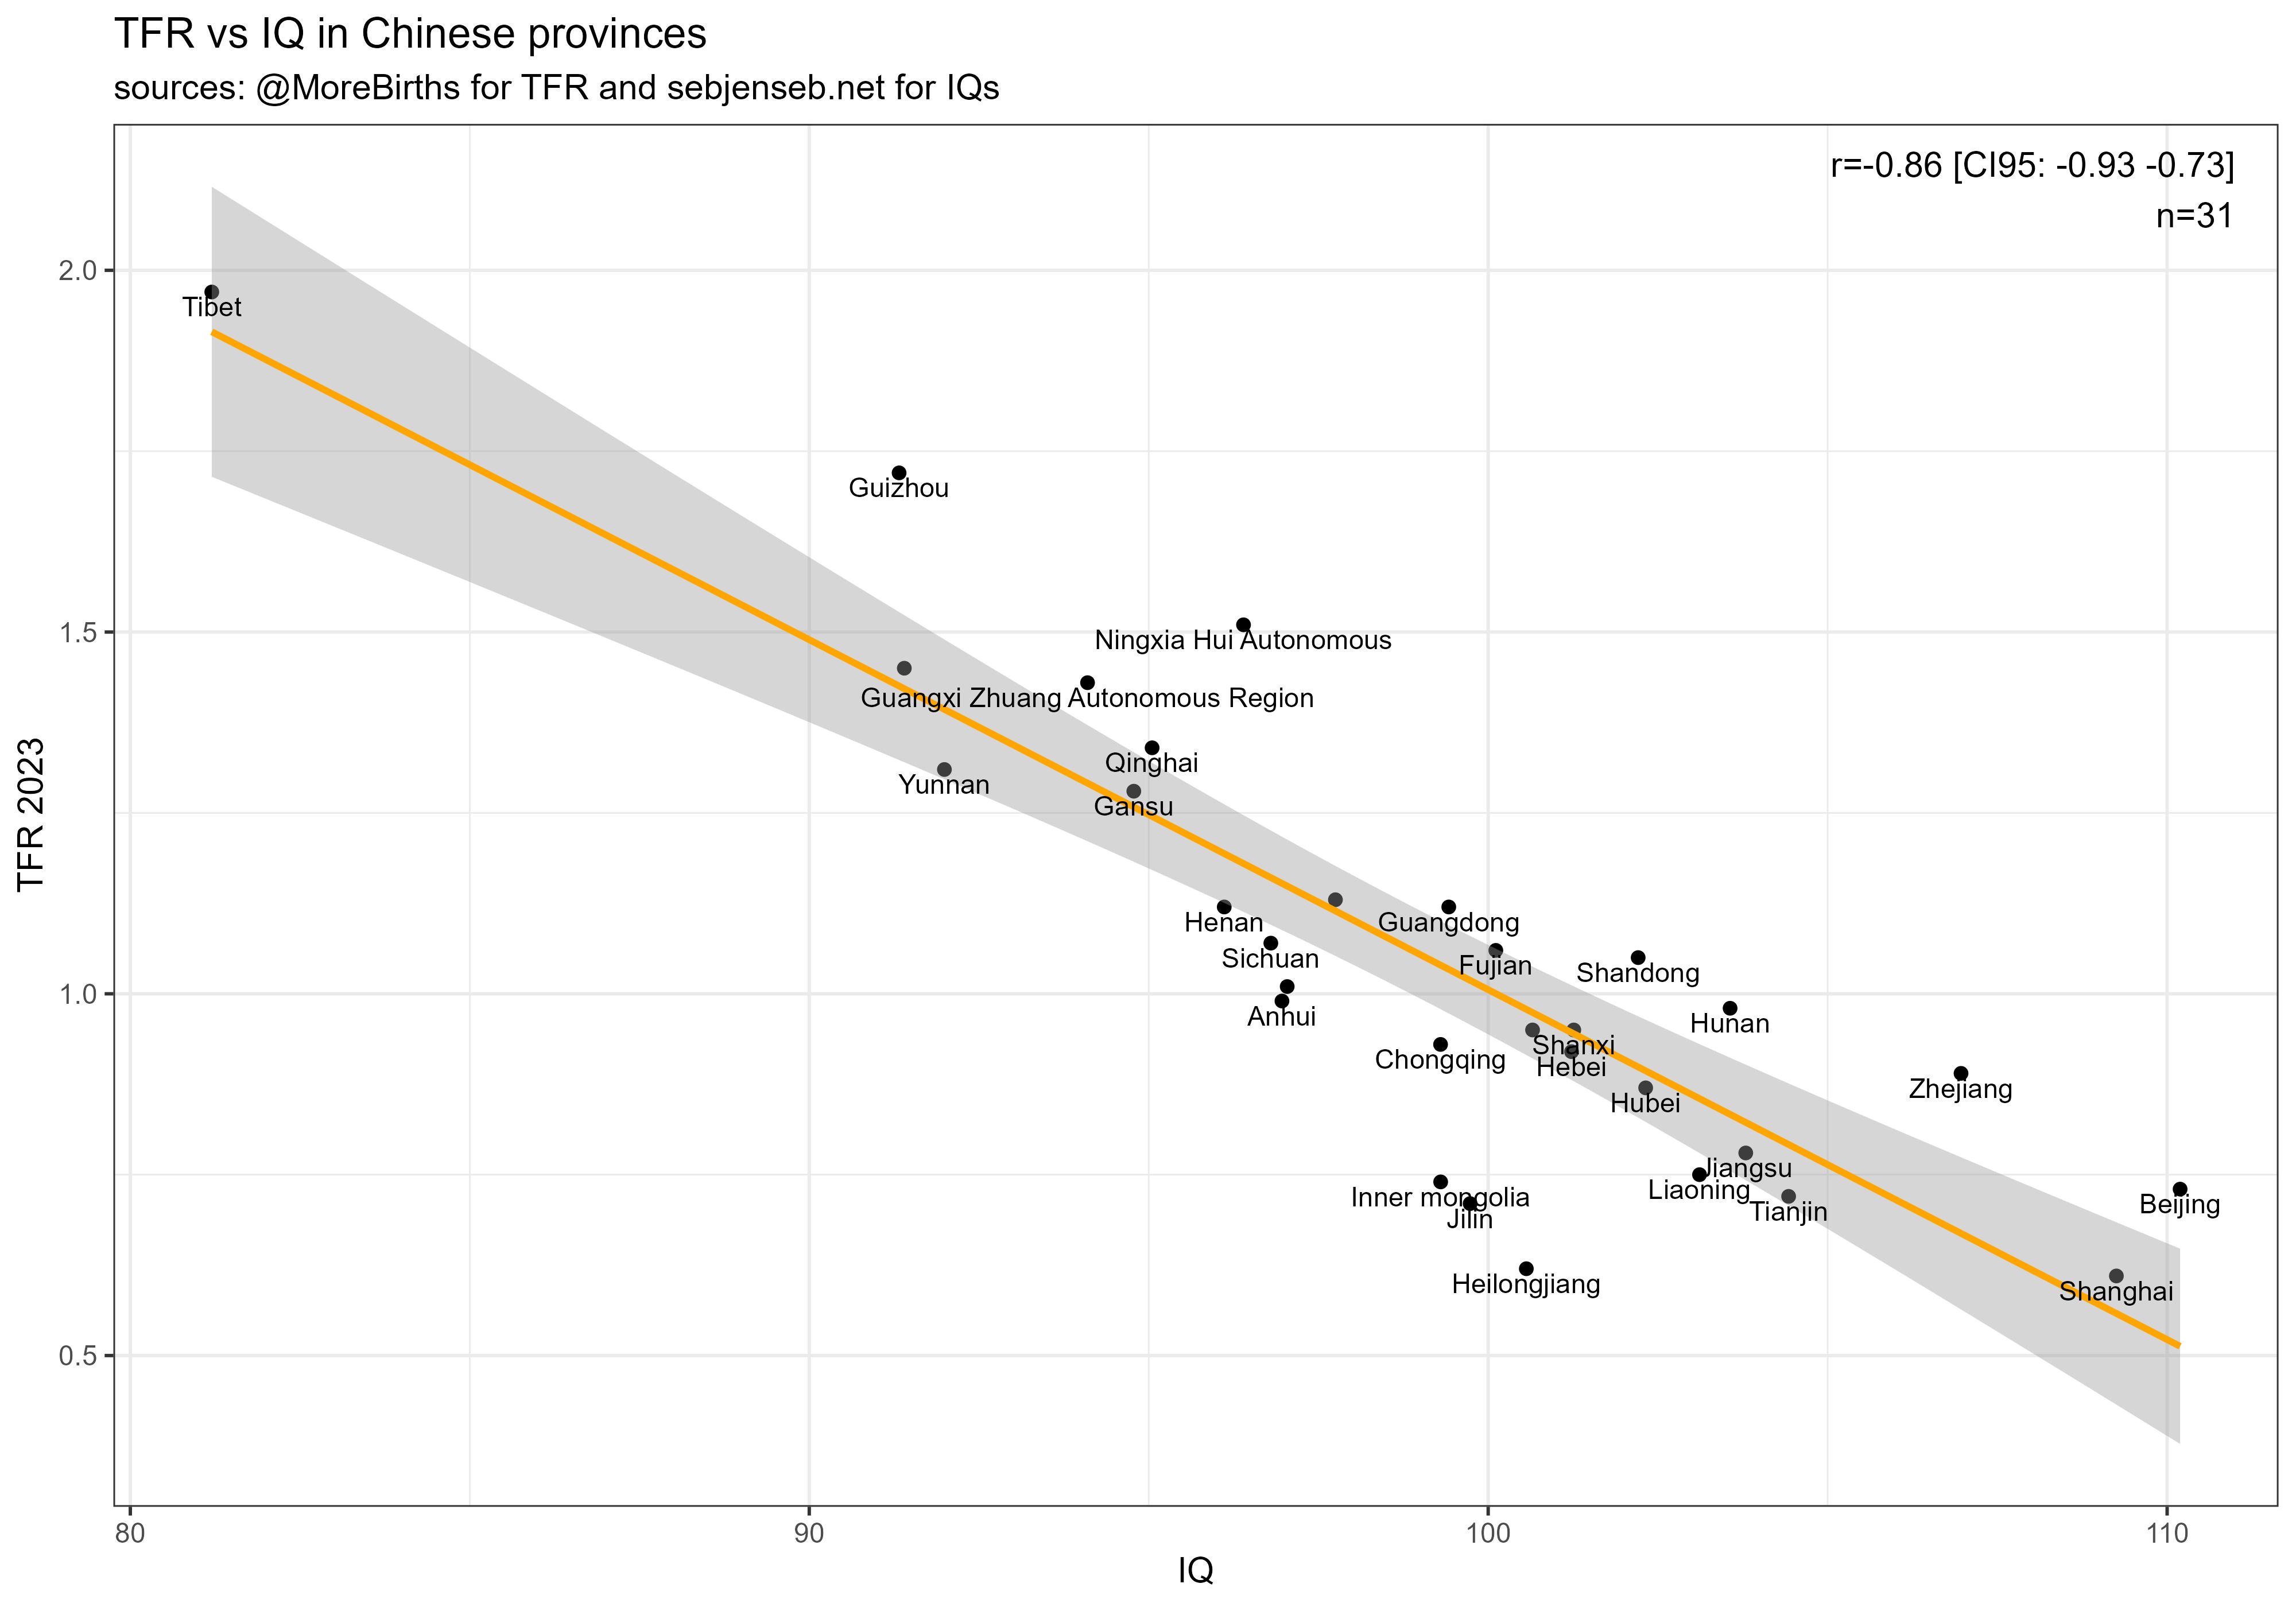
Recreating the viral scatterplot with better data and MoreBirth’s TFR figures:
Question 2
From DeepLeftAnalysis:
when you created the master list of IQs did you ever also produce a master list but differentiating verbal from math IQ to show verbal tilt? Maybe you published this already but wanted to double check -- trying to figure out what's going on with Slavic verbal tilts vs western Europe, maybe create a map of verbal tilts because google search results data looks all messed up
My instant response was that tilt differences between countries were negligible, with the exception that the US seems to be bad at math and that East Asians are not as good as reading as they are at other abilities.
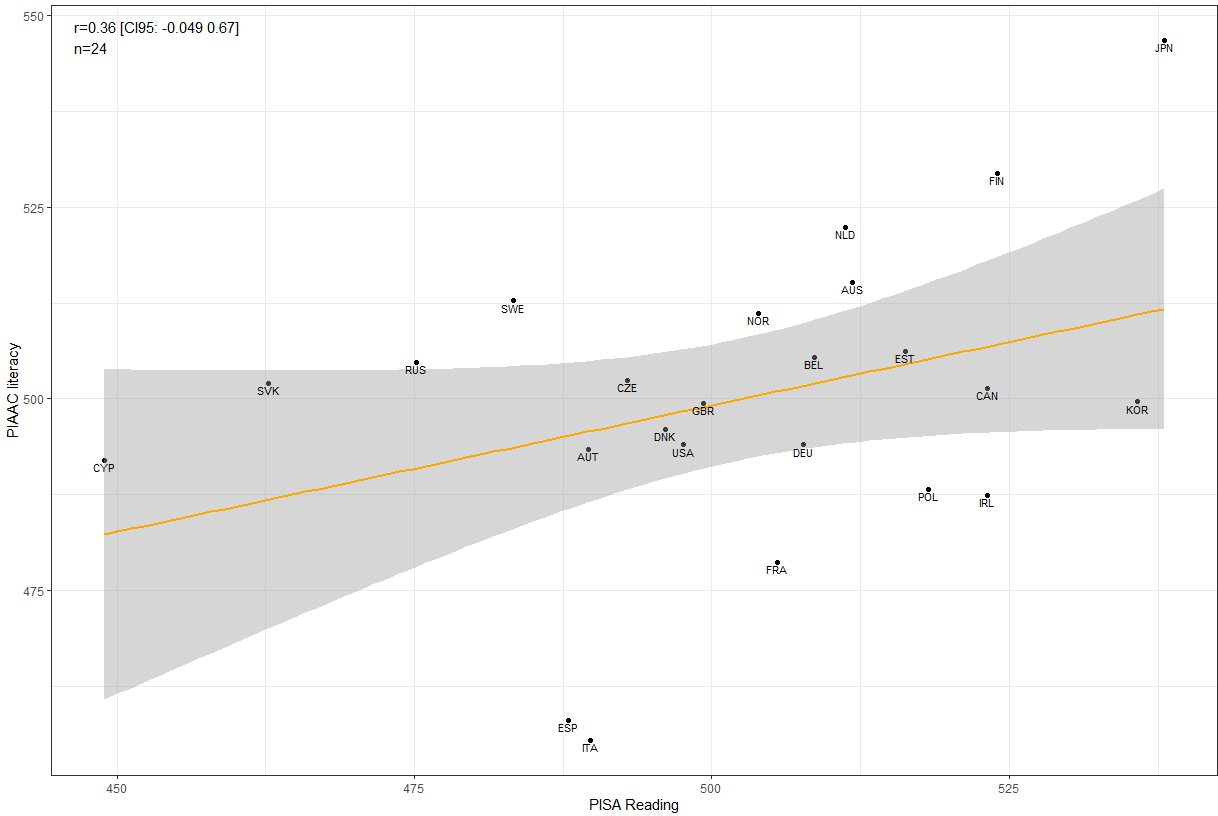
I was proven wrong by my own data. Take, for instance, the correlation in math tilts in the PISA (M-R, 2012) and the PIAAC (N-L, also 2012):

It is worth noting, however, that scores of different abilities from the same dataset correlate higher than scores of the same ability across datasets. That is to say, that the dataset-specific effect is stronger than the ability-specific effect:


EDIT 1 — wrong column was copy-pasted in the first version of the chinese provincial IQs.
These were the averages from the Iodine study:
> dante %>% select(provcd18, Iodine)
                           provcd18 Iodine
1                           Beijing  114.1
2                           Tianjin  105.3
3                             Hebei  105.4
4                            Shanxi  108.0
5                    Inner mongolia  105.1
6                          Liaoning  107.5
7                             Jilin  107.0
8                      Heilongjiang  101.4
9                          Shanghai  115.3
10                          Jiangsu  109.0
11                         Zhejiang  115.8
12                            Anhui   98.2
13                           Fujian  107.1
14                          Jiangxi   98.9
15                         Shandong  107.9
16                            Henan   95.4
17                            Hubei  105.3
18                            Hunan  103.8
19                        Guangdong  101.1
20 Guangxi Zhuang Autonomous Region   98.3
21                           Hainan   90.7
22                        Chongqing  106.3
23                          Sichuan  105.4
24                          Guizhou   92.8
25                           Yunnan   96.8
26                            Tibet   77.3
27                          Shaanxi  104.7
28                            Gansu   96.9
29                          Qinghai   92.8
30           Ningxia Hui Autonomous   93.4
31 Xinjiang Uygur Autonomous Region   98.2
With EA being higher in the South than the North, this would point to the stereotypical Asian submissiveness and rule following ant behavior being prevalent in the South
Highest math tilt in Europe looks like Slovakia, lowest is Ireland/Spain, as I had thought. Evidence of between-country differences in verbal tilt looks strong -- what would be the best way to sort the data into a map?