
Statistics hide the strong relationship between IQ and wealth
true correlation between intelligence and lifetime wealth is 0.5

It’s easy to calculate a correlation. Take column 1 and column 2, write a command into your computer, and the deed is done.

A correlation of 0.291. 9% of the variance in net worth can be predicted by intelligence.
Which is… misleading.
Here, intelligence is estimated by IQ scores. Highly correlated, but imperfectly; a recurring theme of the blog. This adds a bit of noise to correlations, as they are largely a function of the underlying variable that they measure and not the test itself.
Net worth is estimated using a respondent’s self-reports of the value of their cars, houses, stocks, retirement funds, and other assets. Self-reports, ignoring those of personality, are generally overly maligned and can be trusted in most situations. Those of height and weight are reliable (r > .9), for income, the reliability of self-reports is about .8 to .9 depending on the study; I’d assume the same is true of assets. Cremieux told me a hilarious reason as to why there is misreported income in surveys, but that’s his story to tell, not mine.
Net worth and income varies across lifespan; the correlation between income in 2004 and 2020 is .61, for net worth it is .58. As such, lifelong measurements should be expected to correlate more strongly with IQ, or any other variable for that matter. Presumably, some of the discrepancy in income between years is due to errors in self-reports.
Based on these figures, one can estimate the correlation between g and lifelong income/wealth. Consider the following diagram:
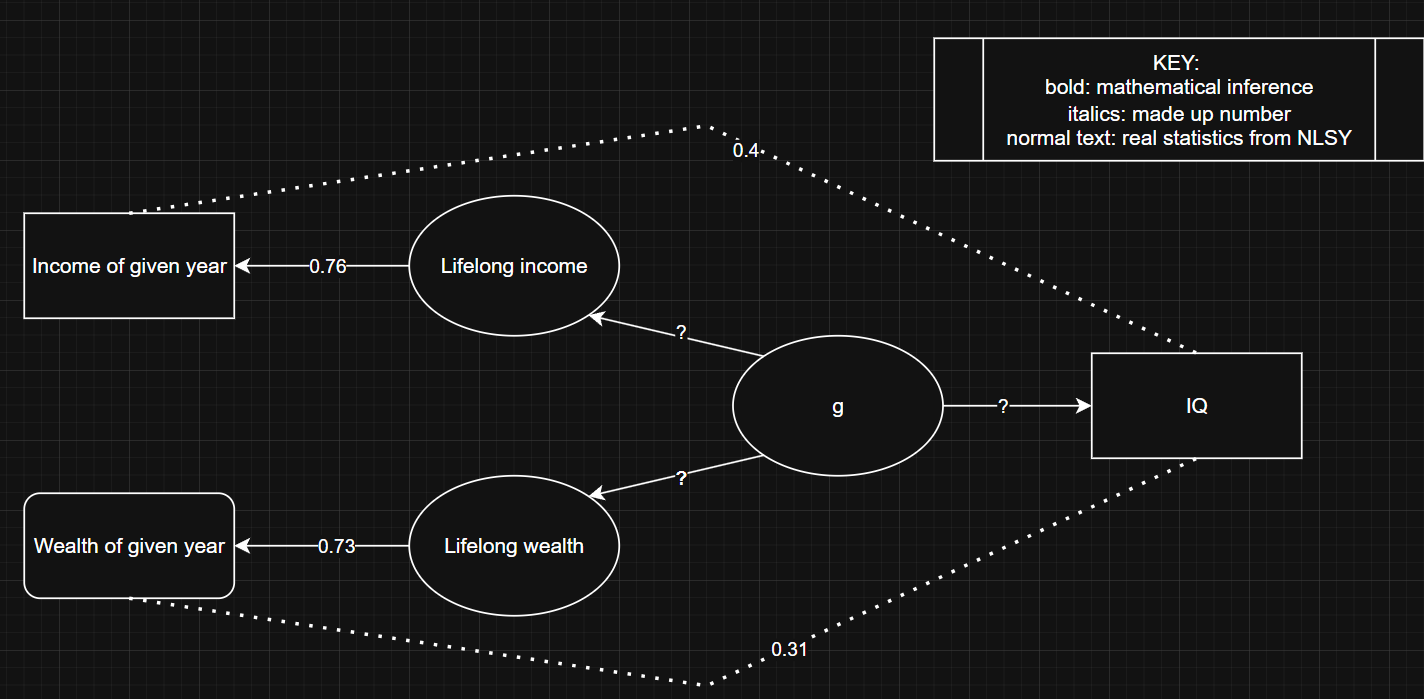
I already filled in statistics that could be estimated using the NLSY792. I gave a rough estimate of the correlation between IQ and g (0.85), and then calculated the two missing correlations:

According to this analysis, g explains 40% of the variance in one’s lifelong income3, and 25% of the variance in one’s lifelong wealth. Not bad, but still implies that noncognitive factors are more important than g when it comes to financial success. Paths can be drawn between income to wealth, though they would not change the estimation of the effect g has on each variable, it would just be assigned to the mediator.
Outliers in wealth/income (<2nd percentile and >98th percentile) were winsorized to the 2nd/98th percentile, as some (but not all) of the data was already truncated; I would have preferred to used uncapped data, but I think consistency is more important.
Before winsorizing, the correlation between IQ and wealth/income in 2004 is .29/.37. After winsorizing, the correlations increase to .32/.43. However, doing so also raises the correlation between wealth/income in 2004 and 2020 from .49/.60 to .58/.58, so it largely has the effect of increasing the consistency of wealth between years, which results in there being less error to correct for.
Winsorizing could also be an issue if extremely high income/wealth is differentially associated with intelligence in comparison to conventionally high levels of financial success. I note that millionaires are slightly slightly more likely (79%) to be self-made than billionaires (70%). Given that most people inherit nothing, I think it’s safe to say there is a tendency for higher levels of wealth to be more likely the result of inheritances, though I note that owners of inherited wealth should still be expected to be above average in intelligence based on genes, common environments, and assortative mating. As such, the non-linearity in the relationship between IQ and wealth is likely to be minimal.
It’s also been consistently observed that the effects of intelligence on outcomes are linear4, in the sense that the effect of intelligence continues to be observed at the far tails tails of human ability, another reason to doubt why the decision to winsorize has substantially affected the estimation of parameters.
Fun facts
(Context: sample was born in 1957-1963) The correlation between wealth in 1985 and 2020 is .11 pre-winsorization and .19 post-winsorization.
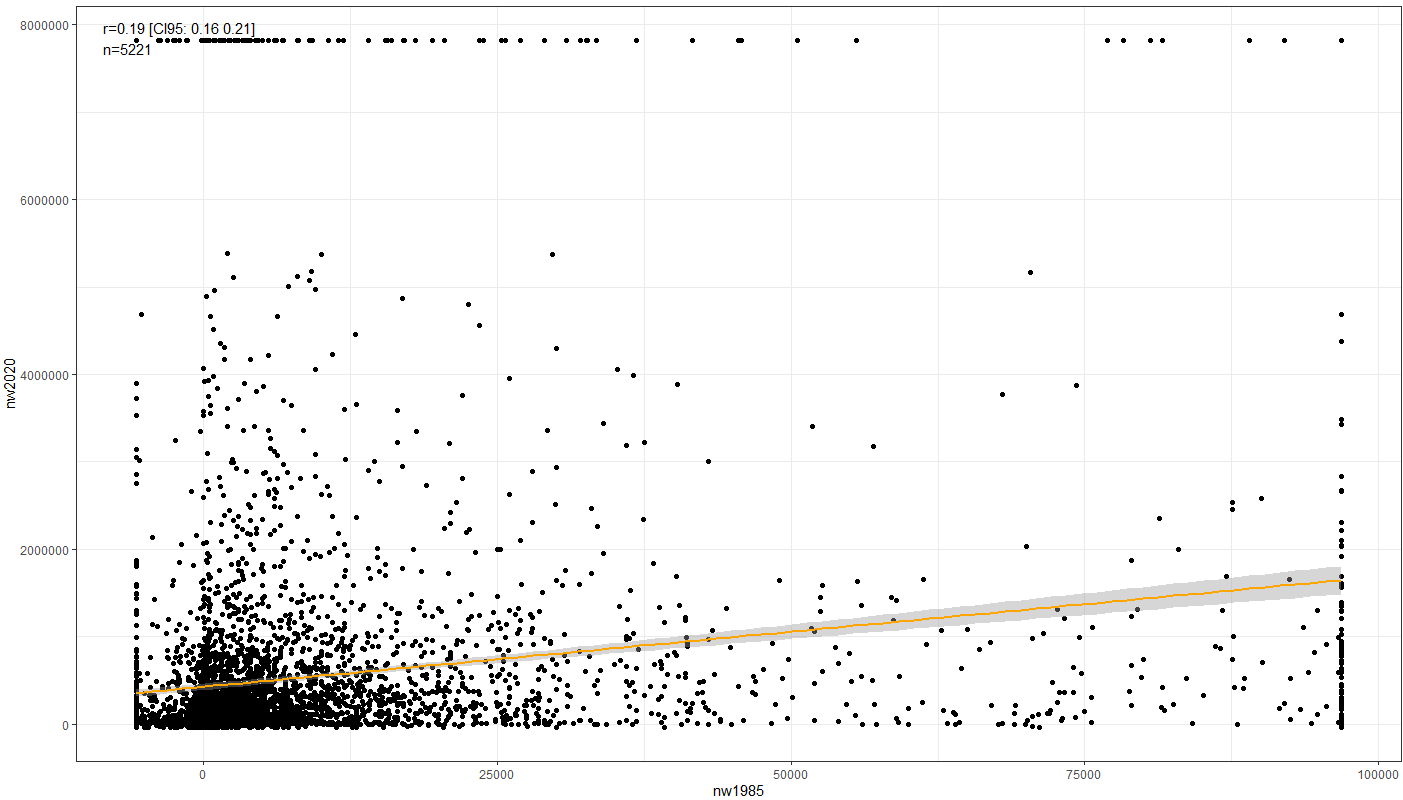
Looks like most people who made it by the time they were 60 were about as wealthy as peers of their same age when they were 25. Based on the descriptive statistics and correlation matrix, wealthy old people almost never did anything of value before their late 20s.


The correlation between IQ income within married women (.25) is two times lower than it is in unmarried women (.48). The correlation between IQ and net worth doesn’t vary by sex, but it is about stronger in married individuals (~.32) than unmarried ones (~.23).
> cor.test(menmarried$nw2004, menmarried$IQ)

	Pearson's product-moment correlation

data:  menmarried$nw2004 and menmarried$IQ
t = 13.873, df = 1839, p-value < 0.00000000000000022
alternative hypothesis: true correlation is not equal to 0
95 percent confidence interval:
 0.2658540 0.3485837
sample estimates:
      cor
0.3078005

> cor.test(menunmarried$nw2004, menunmarried$IQ)

	Pearson's product-moment correlation

data:  menunmarried$nw2004 and menunmarried$IQ
t = 8.2884, df = 1046, p-value = 0.0000000000000003493
alternative hypothesis: true correlation is not equal to 0
95 percent confidence interval:
 0.1905591 0.3042332
sample estimates:
      cor
0.2482506

> cor.test(womenmarried$nw2004, womenmarried$IQ)

	Pearson's product-moment correlation

data:  womenmarried$nw2004 and womenmarried$IQ
t = 14.684, df = 1788, p-value < 0.00000000000000022
alternative hypothesis: true correlation is not equal to 0
95 percent confidence interval:
 0.2860618 0.3687718
sample estimates:
      cor
0.3280453

> cor.test(womenunmarried$nw2004, womenunmarried$IQ)

	Pearson's product-moment correlation

data:  womenunmarried$nw2004 and womenunmarried$IQ
t = 7.4905, df = 1111, p-value = 0.0000000000001395
alternative hypothesis: true correlation is not equal to 0
95 percent confidence interval:
 0.1625930 0.2744829
sample estimates:
      cor
0.2192587

> cor.test(menmarried$inc2004, menmarried$IQ)

	Pearson's product-moment correlation

data:  menmarried$inc2004 and menmarried$IQ
t = 22.543, df = 2073, p-value < 0.00000000000000022
alternative hypothesis: true correlation is not equal to 0
95 percent confidence interval:
 0.4084849 0.4776284
sample estimates:
      cor
0.4437168

> cor.test(menunmarried$inc2004, menunmarried$IQ)

	Pearson's product-moment correlation

data:  menunmarried$inc2004 and menunmarried$IQ
t = 15.621, df = 1093, p-value < 0.00000000000000022
alternative hypothesis: true correlation is not equal to 0
95 percent confidence interval:
 0.3775222 0.4744436
sample estimates:
      cor
0.4272094

> cor.test(womenmarried$inc2004, womenmarried$IQ)

	Pearson's product-moment correlation

data:  womenmarried$inc2004 and womenmarried$IQ
t = 12.378, df = 2228, p-value < 0.00000000000000022
alternative hypothesis: true correlation is not equal to 0
95 percent confidence interval:
 0.2144017 0.2920862
sample estimates:
      cor
0.2536529

> cor.test(womenunmarried$inc2004, womenunmarried$IQ)

	Pearson's product-moment correlation

data:  womenunmarried$inc2004 and womenunmarried$IQ
t = 19.334, df = 1246, p-value < 0.00000000000000022
alternative hypothesis: true correlation is not equal to 0
95 percent confidence interval:
 0.4365237 0.5219548
sample estimates:
      cor
0.4803779 Zagorsky (2007) was wrong, and erroneously calculated it to be 0.16. Friend showed this to me a while ago. Zagorsky (1999) (which is cited by Zagorsky 2007 as a reference for the method used to clean the wealth data) recommends eliminating suspiciously high or low wealth estimates from the dataset to compute proper correlations; eliminating people with self-reported net worths of $2M increases the correlation to 0.34. The NLSY typically has stronger correlations between IQ and other variables due to its high quality intelligence test and representative sampling.
For income, I used “TOTAL INCOME FROM WAGES AND SALARY IN PAST CALENDAR YEAR (TRUNC) (REVISED)” and for assets I used “FAMILY NET WEALTH (TRUNC) *KEY*”. IQ is calculated by correcting the subtests for age using a spline and taking the first principal component. Income years are 1985, 1986, 1987, 1988, 1989, 1990, 1991, 1992, 1993, 1994, 1996, 1998, 2000, 2002, 2004, 2006, 2008, 2010, 2012, 2016, 2018, and 2020; net worth years are 1985, 1986, 1987, 1988, 1989, 1990, 1992, 1993, 1994, 1996, 1998, 2000, 2004, 2008, 2012, 2016, 2020.
Descriptive statistics before consistently winsorizing:

After:

Correlation between net worth and IQ by year (cohort was born in 1957-1963):
nw1985                          0.1915669
nw1986                          0.2143413
nw1987                          0.2278208
nw1988                          0.2389674
nw1989                          0.2603419
nw1990                          0.2584562
nw1992                          0.3076305
nw1993                          0.3194009
nw1994                          0.3373114
nw1996                          0.3537400
nw1998                          0.3821961
nw2000                          0.3868561
nw2004                          0.3341513
nw2008                          0.3722196
nw2012                          0.3835657
nw2016                          0.3932757
nw2020                          0.3638399
Correlation between income and IQ by year
inc1985_1                              0.2937187
inc1986_1                              0.3183926
inc1987_1                              0.3475837
inc1988_1                              0.3763124
inc1989_1                              0.3877735
inc1990_1                              0.4018971
inc1991_1                              0.4127902
inc1992_1                              0.4230221
inc1993_1                              0.4214160
inc1994_1                              0.4339636
inc1996_1                              0.4317206
inc1998_1                              0.4210621
inc2000_1                              0.3850343
inc2002                                0.3895497
inc2004                                0.4273943
inc2006                                0.4257555
inc2008                                0.4389298
inc2010                                0.4532089
inc2012                                0.4074006
inc2014                                0.4009317
inc2016                                0.4157446
inc2018                                0.3850513
inc2020 0.3572569Dalliard tried his hand at a similar project: he showed that the correlation between IQ and income from multiple years was stronger than that of one year. I have some issues with some of the methods he used, notably not adjusting for the fact that some years yield more income than others, and not noting that there are other biases in the IQ~income correlation in other datasets like restriction of range or measurement error in intelligence that lead to the NLSY having an “unusually” high correlation between IQ and income.
I note that IQ scores are usually forced to a normal distribution, so observed linear effects between IQ and outcomes may not correspond to true intelligence
Edit 1 — clarified the lack of a path between wealth and income.
As I believe Clark has argued, there is often tradeoff between income and other desirable aspects of the job. Many university professors make much less than they would doing something else, but like independence and job security and schedule flexibility. Another reason why correlations aren’t higher.
Excellent article! I was just pointing this out to someone the other day, but you made the point much better than I could. I also like to point out to people who are overly critical of IQ that they never offer a better measure to predict across life domains. The only one someone ever offered was g, which I then told him was extremely highly correlated to IQ and wouldn't change the results much.
Until they can find a better construct which explains as much individual, group, and national success in the modern world, their criticisms of IQ, while valid considerations, ring a lot more hollow. For example they bring up cultural bias, which in some ways is valid but in other ways is a bit silly. What if some cultures are better able to build economies and integrate into Western or globalized economies? I think this is certainly true but it seems the implication is offensive to some.