
The answer to the "missing heritability problem"
a great red herring

TL;DR: the assumptions made when estimating heritability using genomic data have not been properly deconstructed because the methods used are too new at the moment. Twin studies and adoptee/extended family models generally find the same results with different assumptions, so the assumptions made in these models are probably tenable.
Heritability, the percentage of variation in a trait that is caused by genetics, is traditionally estimated by comparing the resemblance between identical and fraternal twins; the difference in resemblance between identical and fraternal twins is assumed to be due to genetic factors.
Generally, these studies find that a substantial fraction of most traits is caused by genes:
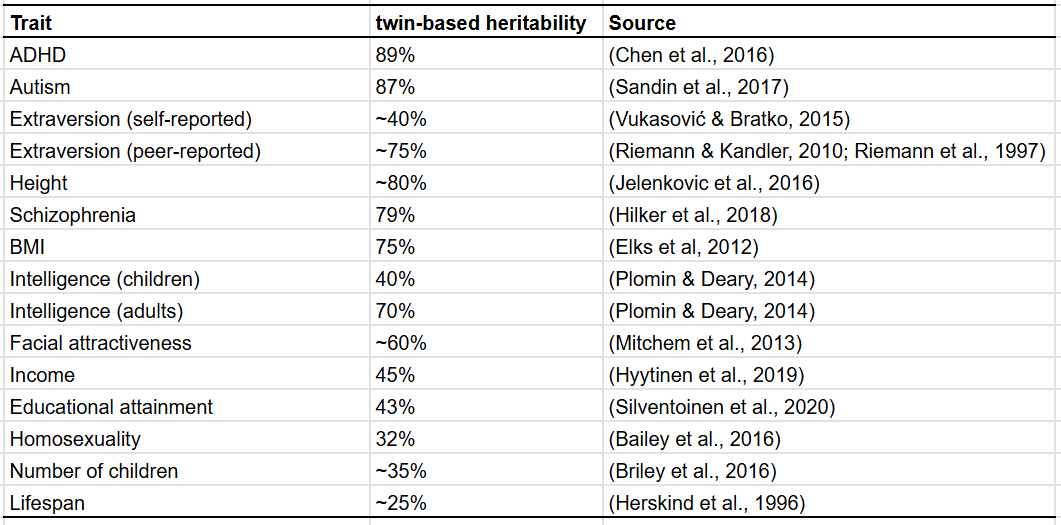
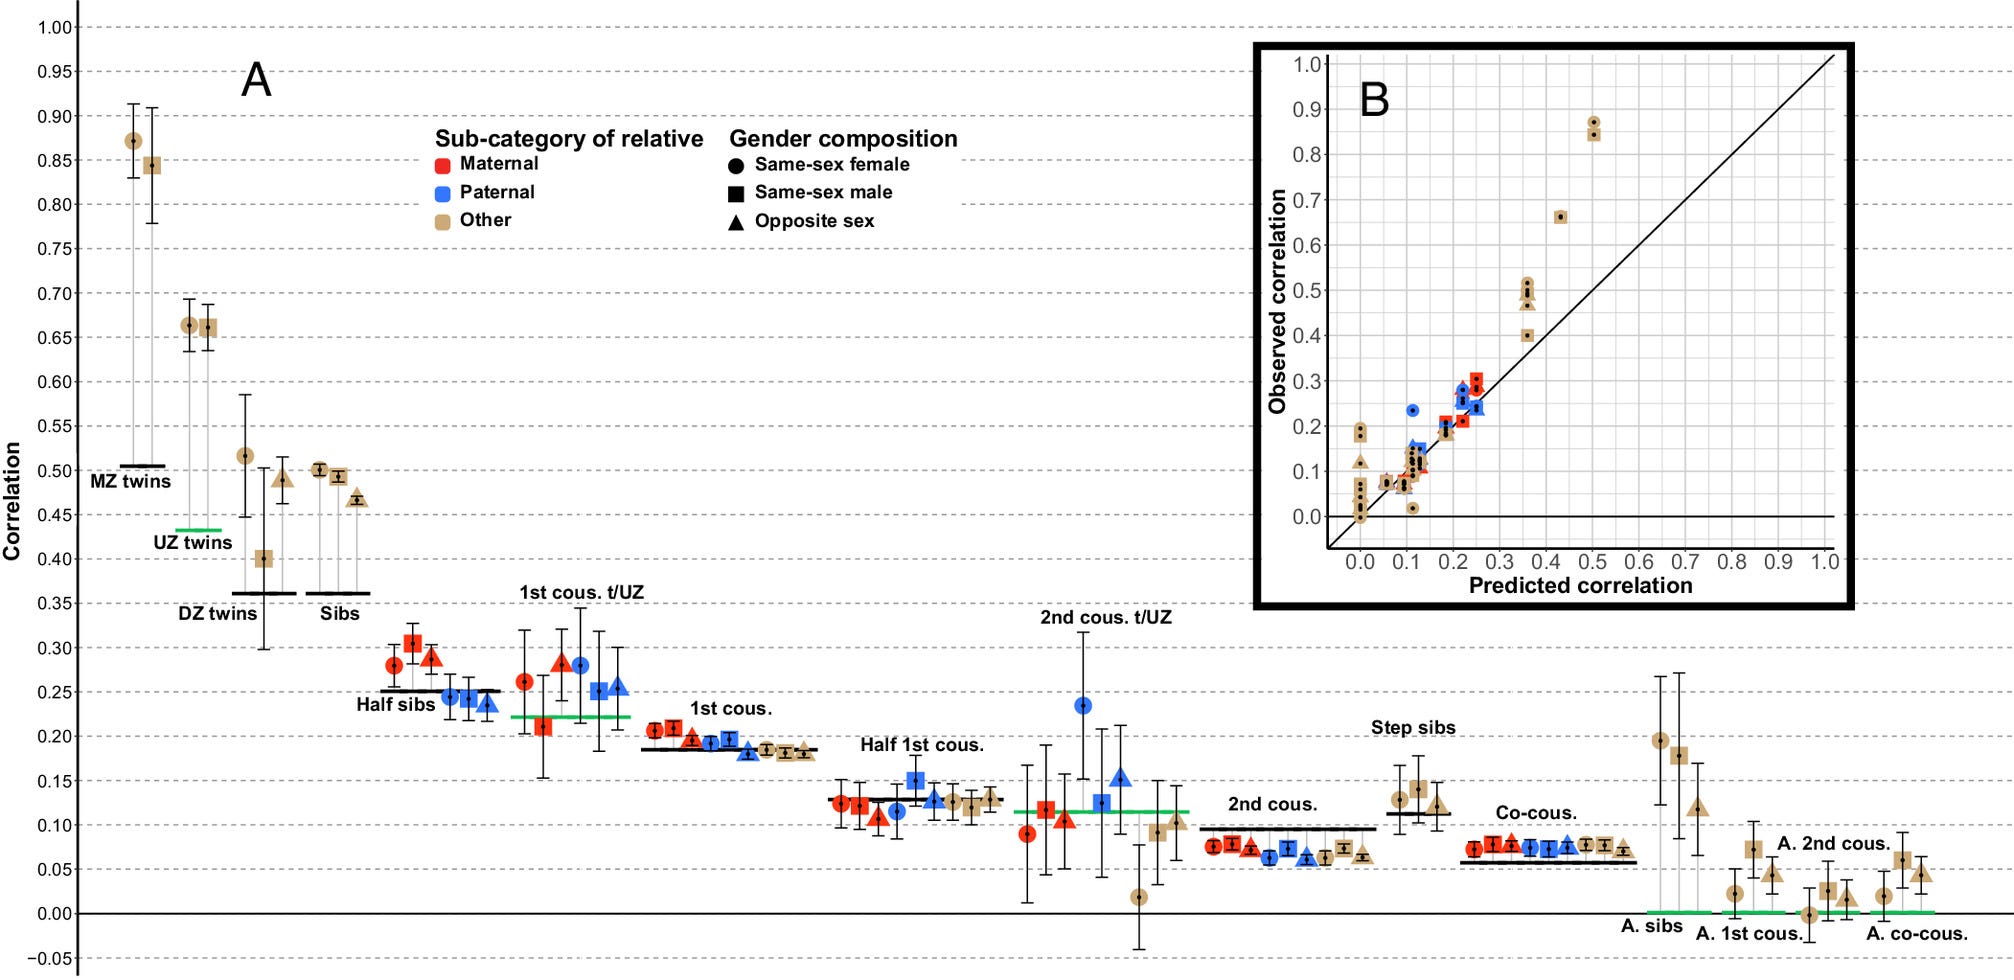
There are infinitely many ways to estimate heritability, all of which have their biases and shortcomings. Leveraging my meta-analysis of 1250 correlations between family members, I was able to find a silver lining: most of them tend to agree with each other.
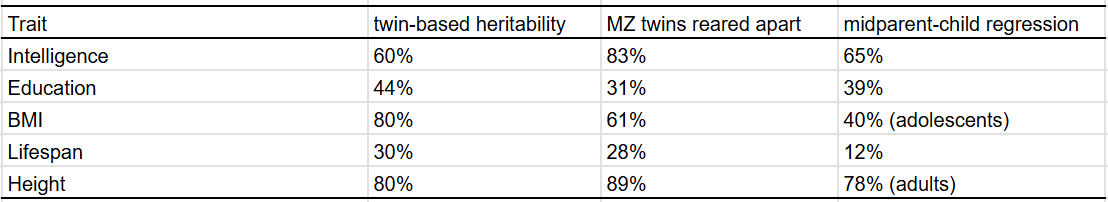
With one exception: studies that use genetic sequencing data to estimate heritability, which typically find lower estimates of heritability; the phenomenon has been dubbed the missing heritability problem. Typically, heritability is estimated using molecular data using one of these four methods:
RDR: leveraging the differences in relatedness between individuals relative to how related their parents are to determine heritability.
Sib-Regression: leveraging the differences in relatedness between siblings to estimate the heritability of a trait.
GREML-GCTA: leveraging the differences between nominally unrelated individuals in relatedness to estimate heritability.
Polygenic score R^2: correlating polygenic scores with phenotypes and taking R^2 as the heritability estimation. Complicated, but not worth explaining because nobody seriously advocates for this method, as it is biased by sample size.
The first three methods are doing effectively the same thing as the pedigree studies of heritability — regressing phenotypic similarity onto genotypic similarity — just with different datasets and estimates of relatedness. Quantitative genetics with extra frills, as East Hunter calls it.
These molecular estimates of heritability also make several tenuous assumptions: no non-additive genetic effects, no assortative mating, no rare/structural variants, and that genetic similarity across the genome is congruent with genetic similarity in the genes that cause the phenotype in question.
Because the literature on molecular heritability is too new, we don’t really know how much the assumptions made in the methods change the results.
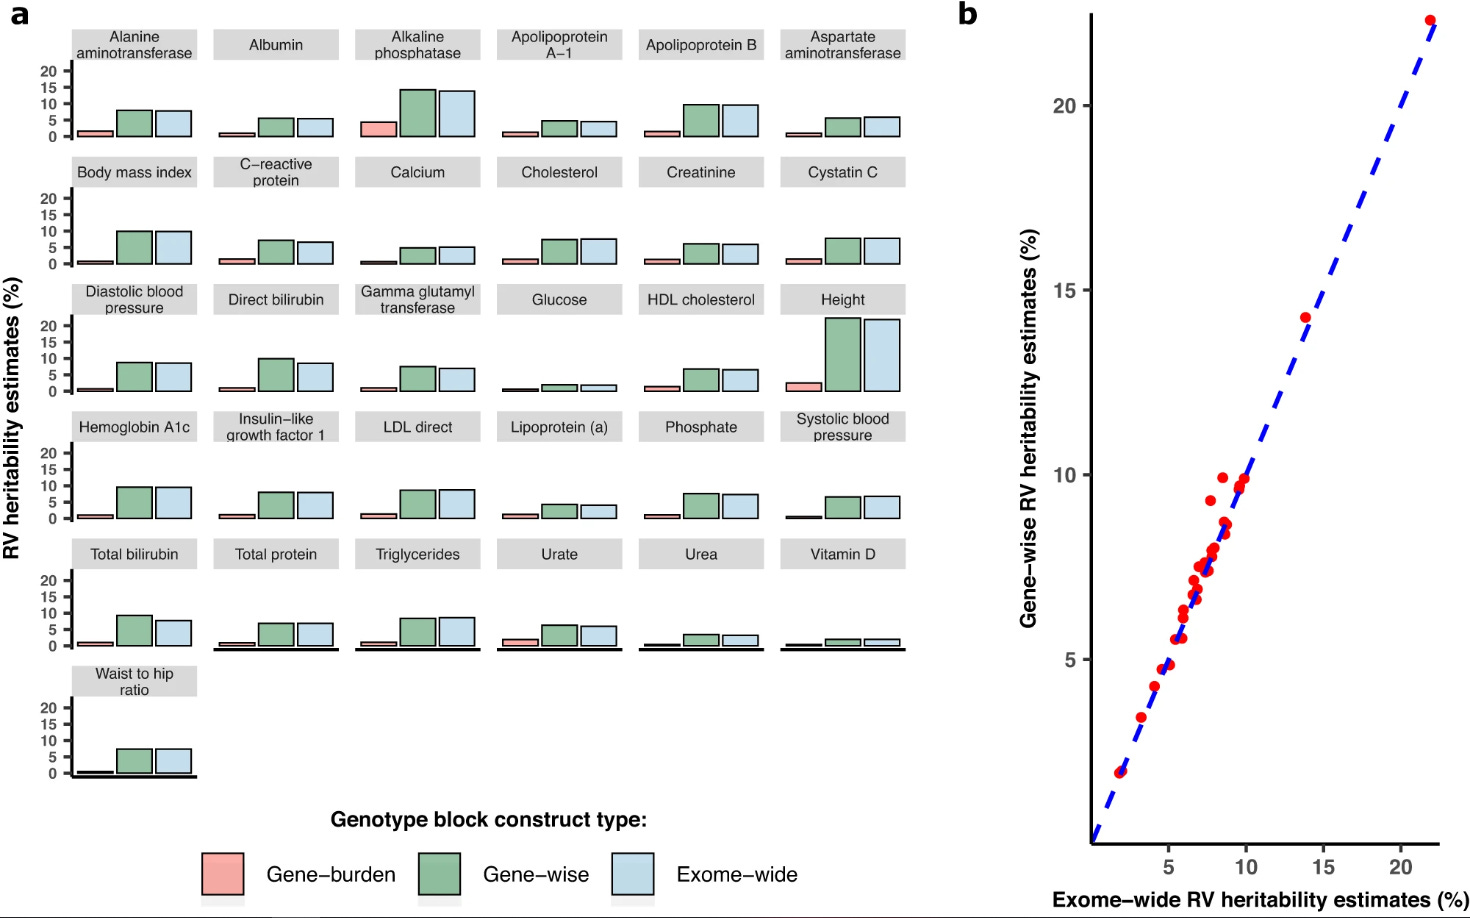
Case in point: some cite a study that finds only 1.3% of the missing heritability can be explained by rare variants, but said estimate could be biased downwards by non-coding variants that their methodology did not account for. I also found a paper that finds that gene-burden accounts for little of the rare variant heritability:
To be honest, I have no idea how bad the rare variant problem is. That last paper I cited was published 1 year ago, for all I know they could be using the wrong analytical technique or dataset.
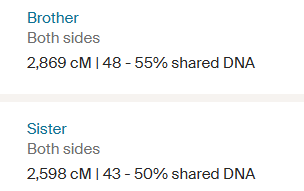
I haven’t seen much discussion of the assumption that whole-genomic similarity is congruent with phenotype-specific genetic similarity. Rationally speaking this is impossible, for example, my older brother is a fair-skinned ginger and my older sister and I both have dark skin/hair. I happen to share more autosomal DNA with my older brother, despite our dissimilarity in appearance:
The solution to the brother/sister paradox is that heritability is not estimated by regressing phenotypic similarity onto genetic similarity, it’s estimated by regressing phenotypic similarity onto similarity in the genes that cause said phenotype. Normal pedigree studies do not have issues making this assumption because similarity in genes relevant to the phenotype regresses to the kinship mean — cousins share 12.5% DNA on average and 12.5% of DNA that causes a given phenotype1, but similarity in genes releveant to the phenotype in nominally unrelated individuals regresses towards the mean of 0. In a similar veign, relatedness between individuals can be misestimated which results in a similar bias occurring.
Indirect genetic effects?
People have tried evaluating whether your parent’s genes affect who you are beyond your own genes using polygenic scores. They usually find that a decent proportion of variance explained by polygenic scores is due to the scores of their parents; in the following image, the y axis denotes the proportion of the variance explained by the child’s polygenic score is not due to the parent’s genes:

There’s a problem here. GWAS tag both causal variants and genes that are associated with those causal variants but are not relevant to the development of said trait. If there is assortment in mating, then having a genetic variant that causes educational attainment will also predict having another. As such, a parent’s polygenic score will have incremental predictive validity over your own polygenic score when predicting your own genetic predisposition to a trait. Within-family GWAS have the same problem. See page 25 of Lee 2018’s supplement for a better explanation.
Looking back at the plot, the ratio of direct effect to population effect is basically a function of how much parents assortatively mate for each trait:
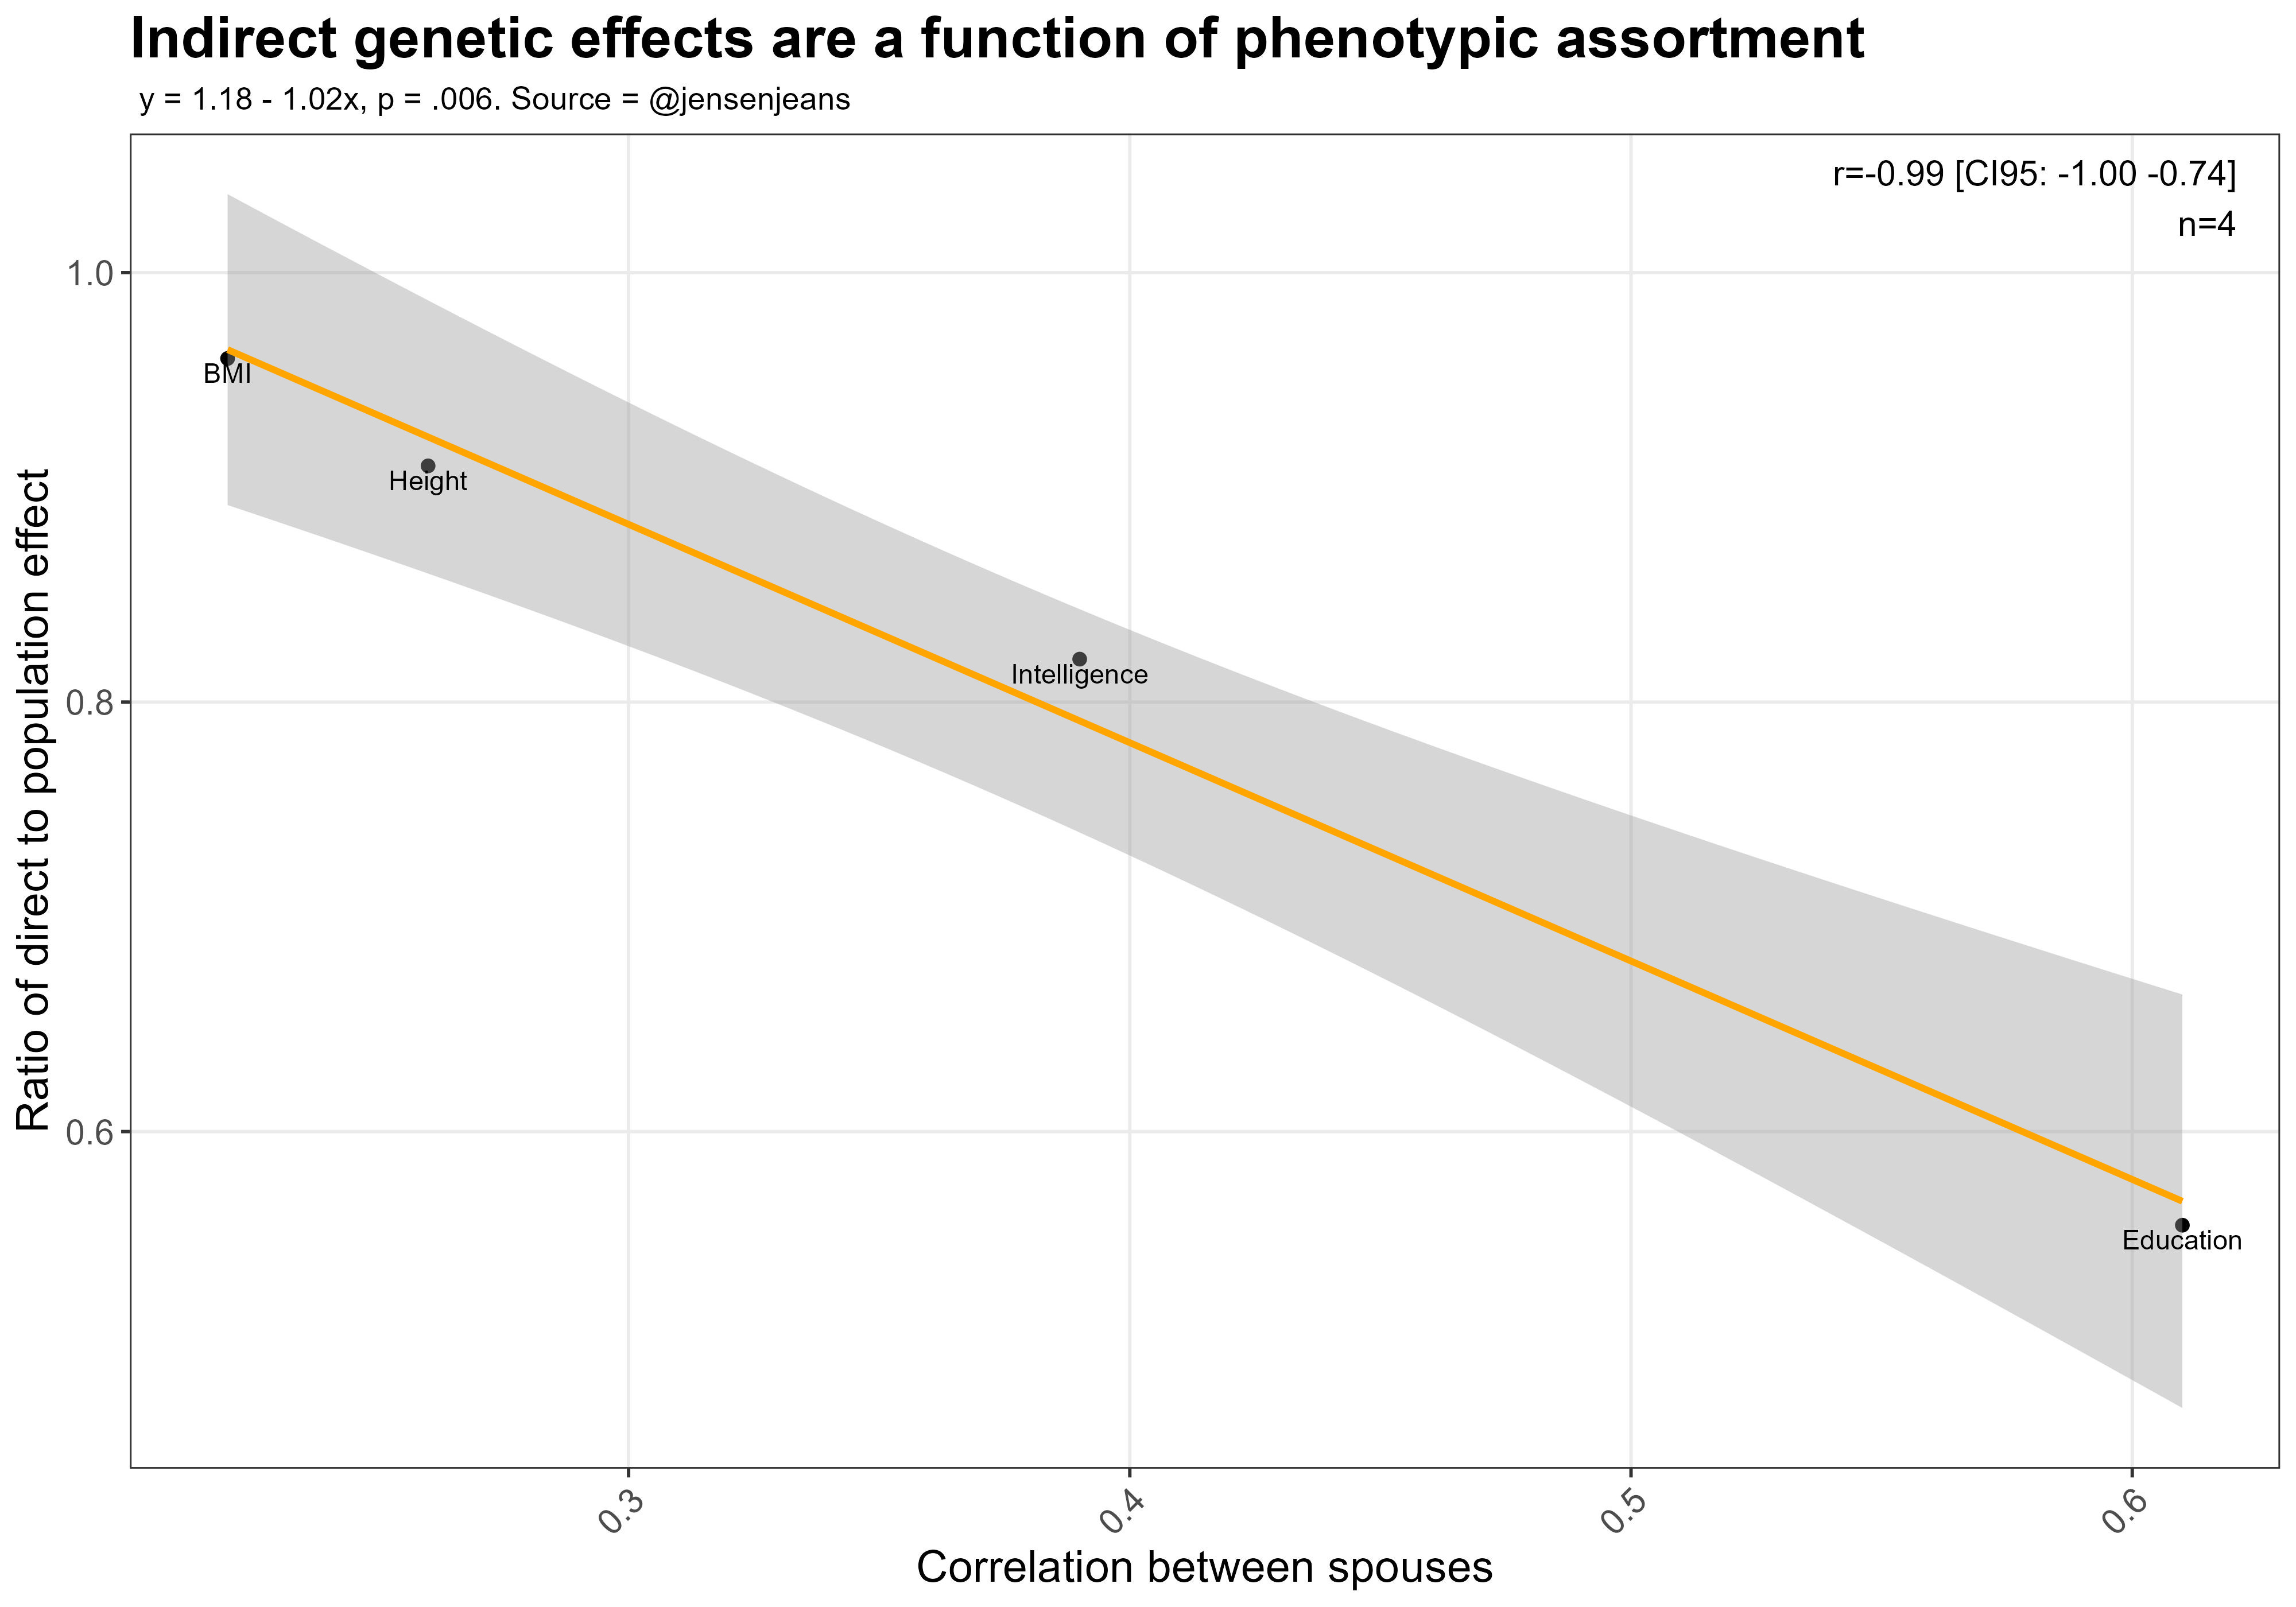
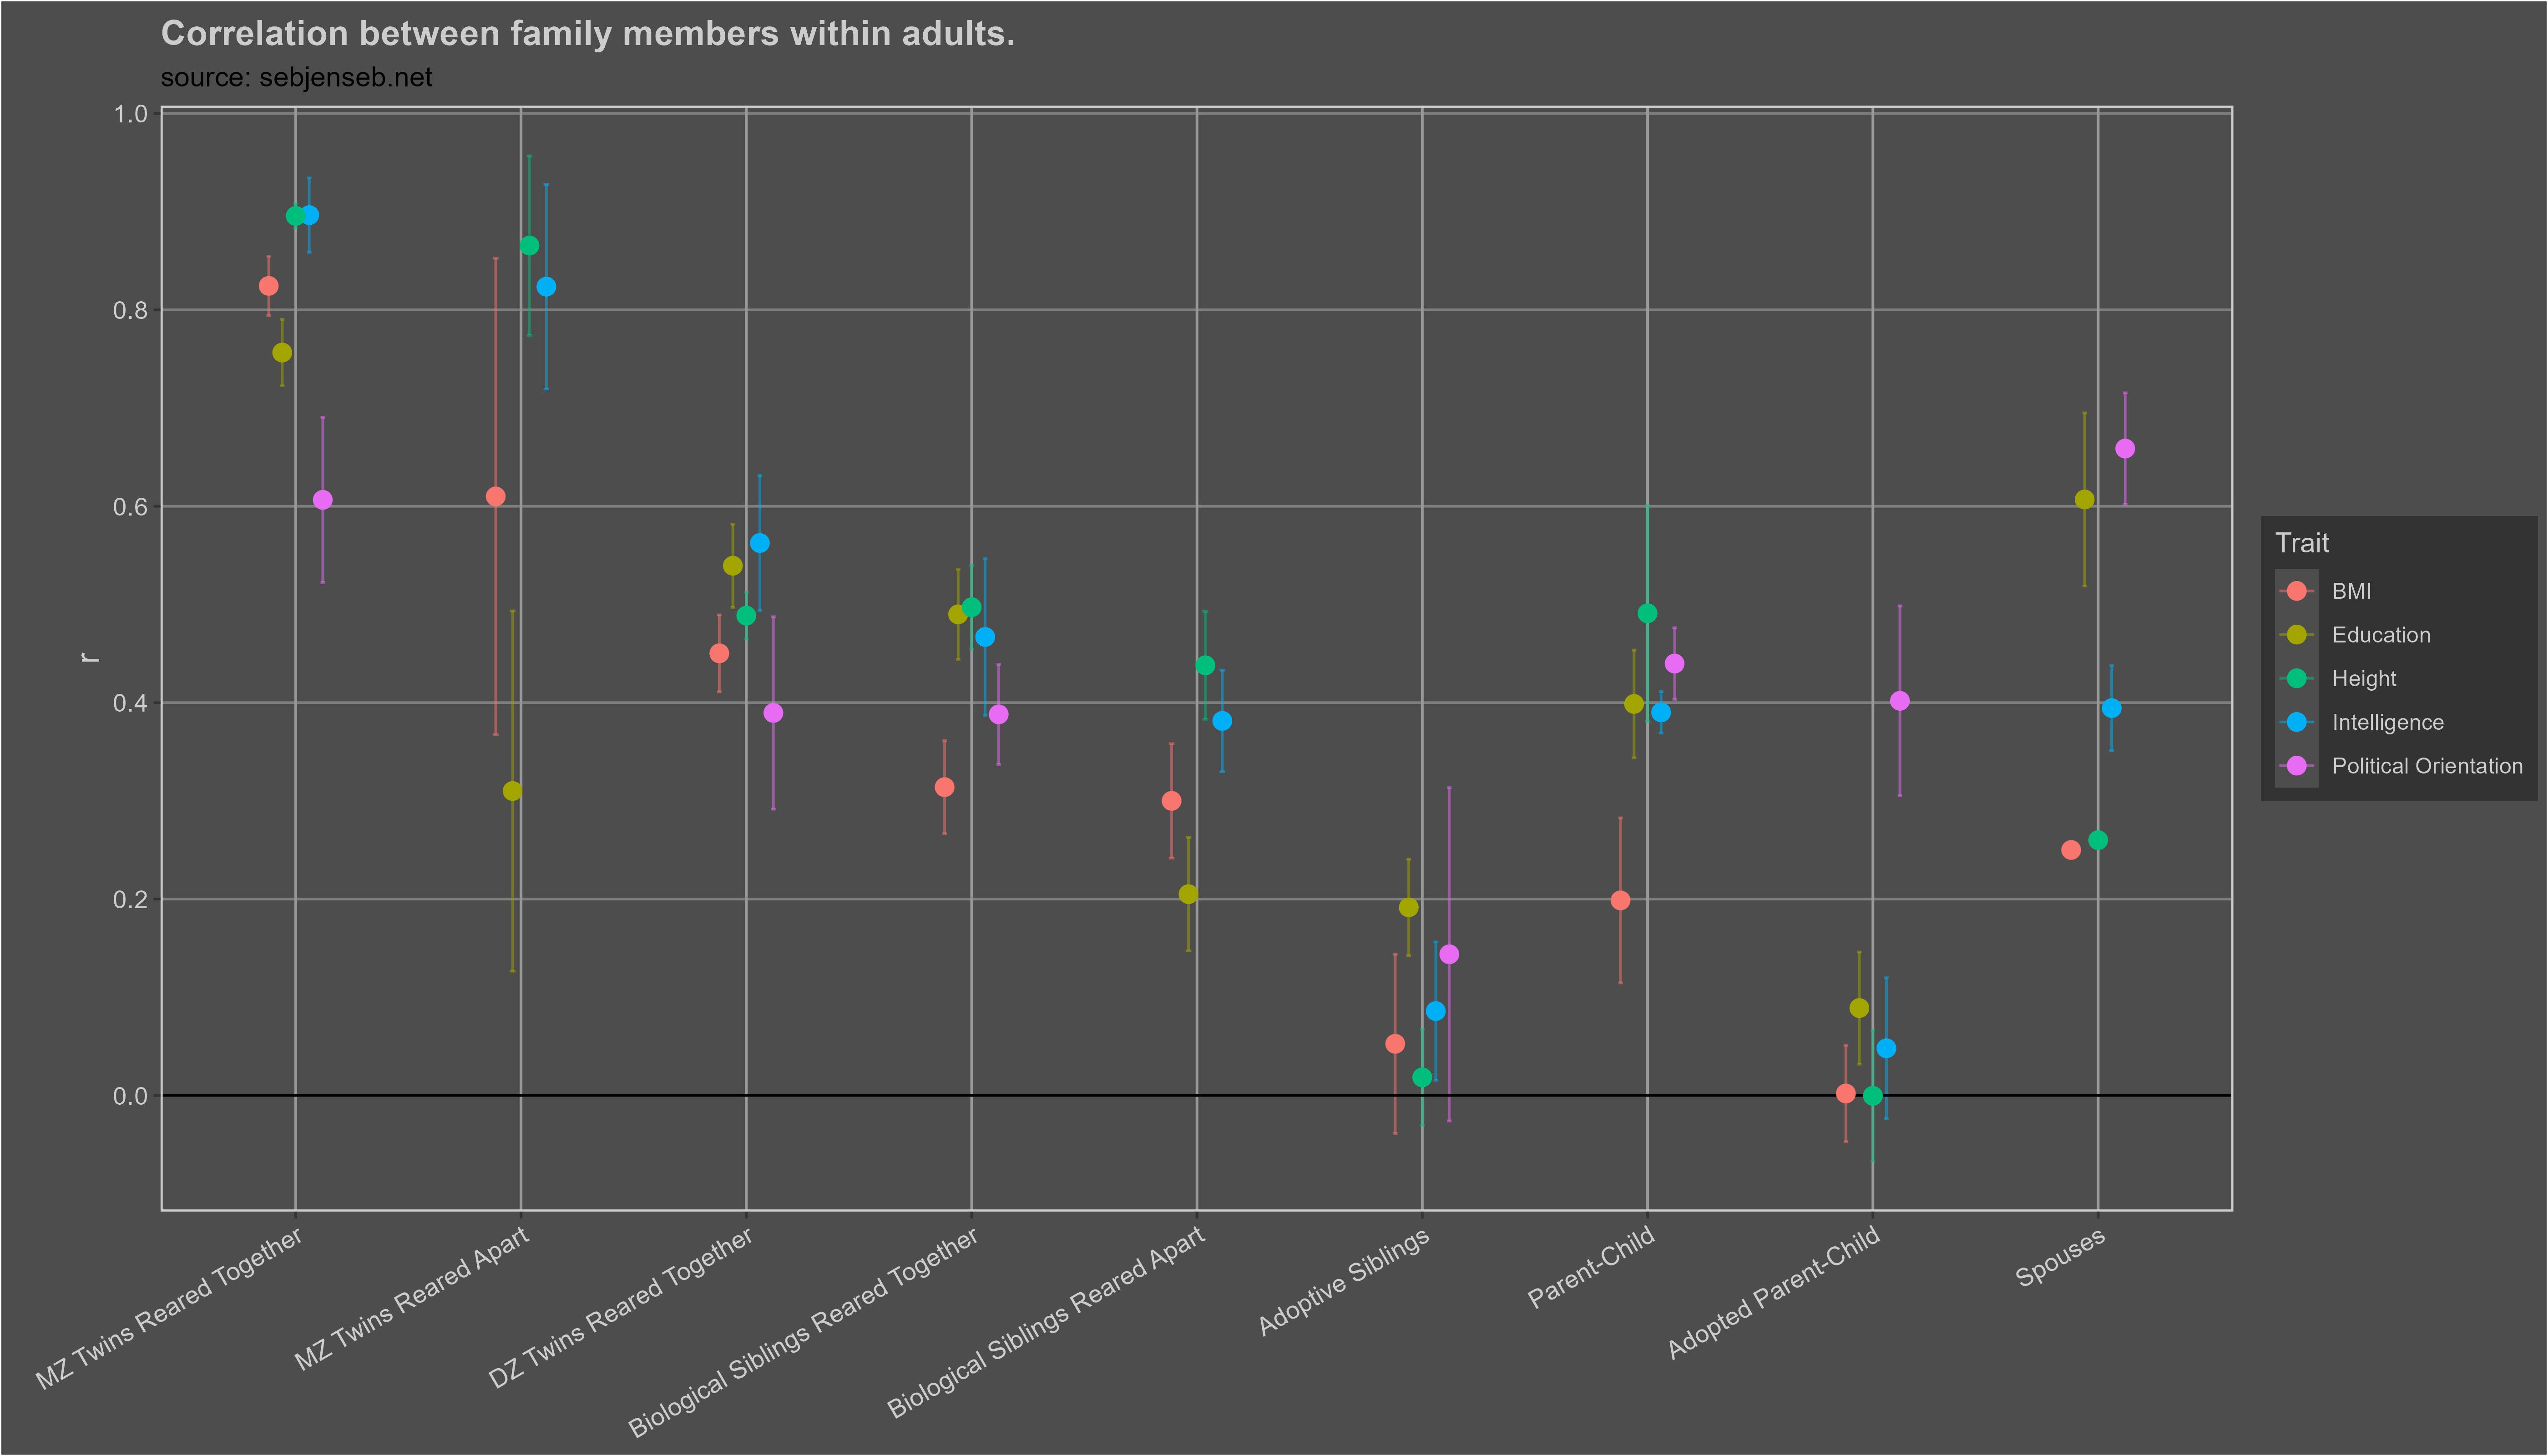
These estimates of indirect genetic effects are also inconsistent with adopted parents and children having little correlation in BMI, height, or intelligence:
Biases in twin studies
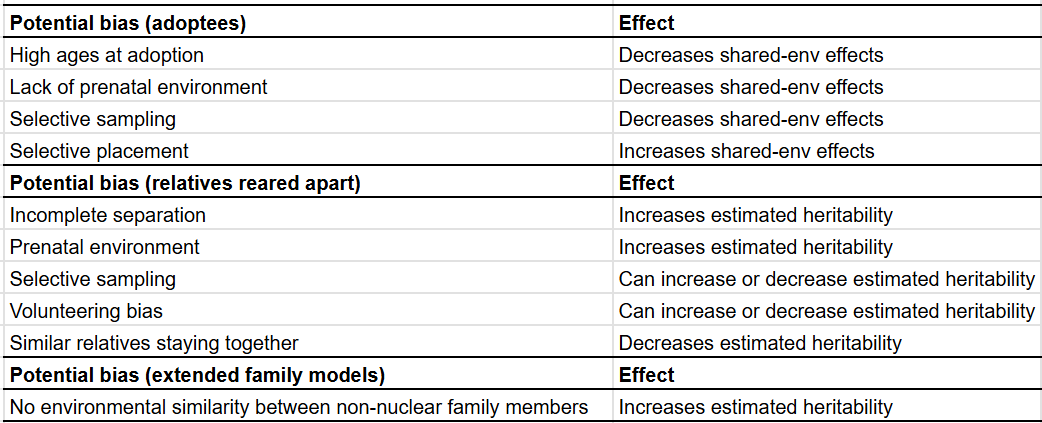
Here are all 22 potential bias that have been alleged to affect heritability estimates2, and my evaluations of them:
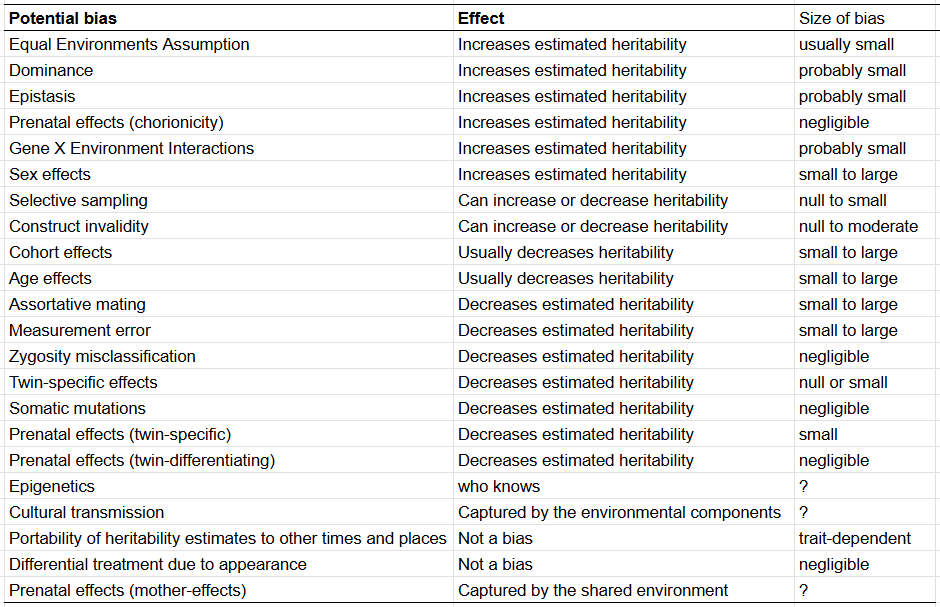
The way I judged the biases was simple. I recalled how the statistical components in twin studies are estimated3 and thought about how each bias would affect each of them. Any factor that inflates similarity between MZ twins and/or deflates similarity between DZ twins results in heritability being overestimated, any factor that inflates similarity between all twins results in the shared environmental component being overestimated, and anything that deflates similarity between twins results in the unshared environment being overestimated.
For example, if twins ages 2-90 take a cognitive test, some of the similarity between the twins will be due to their similarity in age. This will result in the similarity between twins being inflated relative to what would be expected, and as a result the C component is overestimated. Technically one could argue that aging constitutes a real environmental (or genetic) effect, though I think that’s overthinking it a little too much.
I count a total of six biases which inflate heritability estimates and seven which deflate it. Other supposed biases either aren’t actually biases or they are more complex in nature and most of them are not large in terms of magnitude. I wouldn’t say that this means that the inflation is perfectly cancelled out by the deflation, though I think it does mean that twin studies are not mere statistical tomfoolery.
Onto the specific factors; skip to the conclusion if you are disinterested:
Differential treatment due to appearance
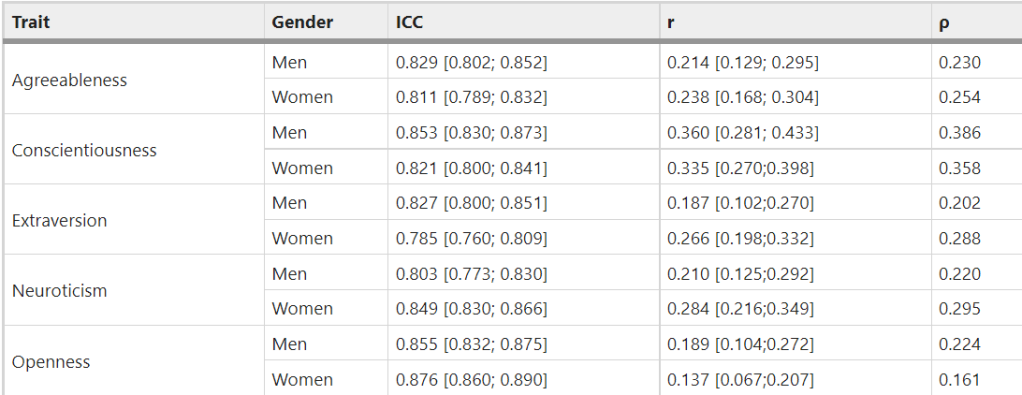
Phenotypically, there are correlations between facial features and personality, but these could easily be a function of physiology and not society. They’re also not very strong: AI can only predict 5-15% of the variance in an individual’s personality based on photographs:
Kachur, A., Osin, E., Davydov, D. et al. Assessing the Big Five personality traits using real-life static facial images. Sci Rep 10, 8487 (2020). https://doi.org/10.1038/s41598-020-65358-6
There is ample evidence that morphological and social cues in a human face provide signals of human personality and behaviour. Previous studies have discovered associations between the features of artificial composite facial images and attributions of personality traits by human experts. We present new findings demonstrating the statistically significant prediction of a wider set of personality features (all the Big Five personality traits) for both men and women using real-life static facial images. Volunteer participants (N = 12,447) provided their face photographs (31,367 images) and completed a self-report measure of the Big Five traits. We trained a cascade of artificial neural networks (ANNs) on a large labelled dataset to predict self-reported Big Five scores. The highest correlations between observed and predicted personality scores were found for conscientiousness (0.360 for men and 0.335 for women) and the mean effect size was 0.243, exceeding the results obtained in prior studies using ‘selfies’. The findings strongly support the possibility of predicting multidimensional personality profiles from static facial images using ANNs trained on large labelled datasets. Future research could investigate the relative contribution of morphological features of the face and other characteristics of facial images to predicting personality.
Facial attractiveness, based on composites of 12 different raters, also correlates weakly with observed intelligence (r = .07)4. The existence of this correlation does not prove that attractiveness causes intelligence, as it could be the function of physiology or mutations. There is also cross-trait assortative mating between attractiveness and intelligence, where intelligent people are slightly more likely to date attractive people. As such, there should be a weak but not-necessarily-causal correlation between attractiveness and intelligence.
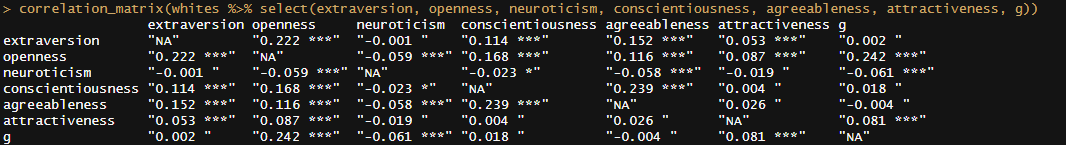
The only two personality traits that correlate with attractiveness in the Wisconsin Longitudinal Study are extraversion (r = .05) and openness (r = .09). All other correlations are not statistically significant:
In terms of earnings, attracitveness has very little effect on them even after controlling for IQ5: a 1 SD change in attractiveness is associated with a ~3% increase in earnings. As in the case with intelligence and attractiveness, causation doesn’t equal correlation, and the relationship could be easily explained by mutations or cross-trait assortative mating.
Beyond cross-sectional correlations, there have been studies conducted on look-alikes, people who look as similar to each other as identical twins:
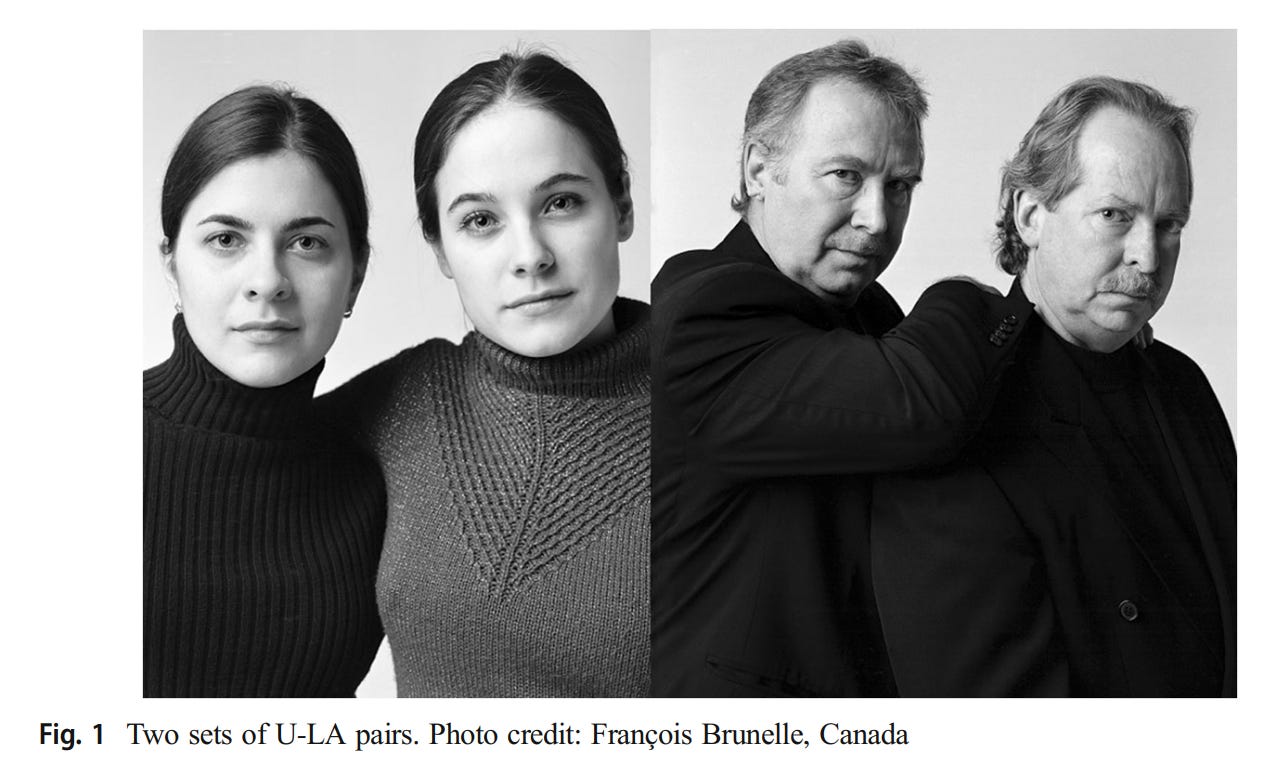
When 37 of these look-alike pairs had their personalities tested, they were no more related to each other than random people:
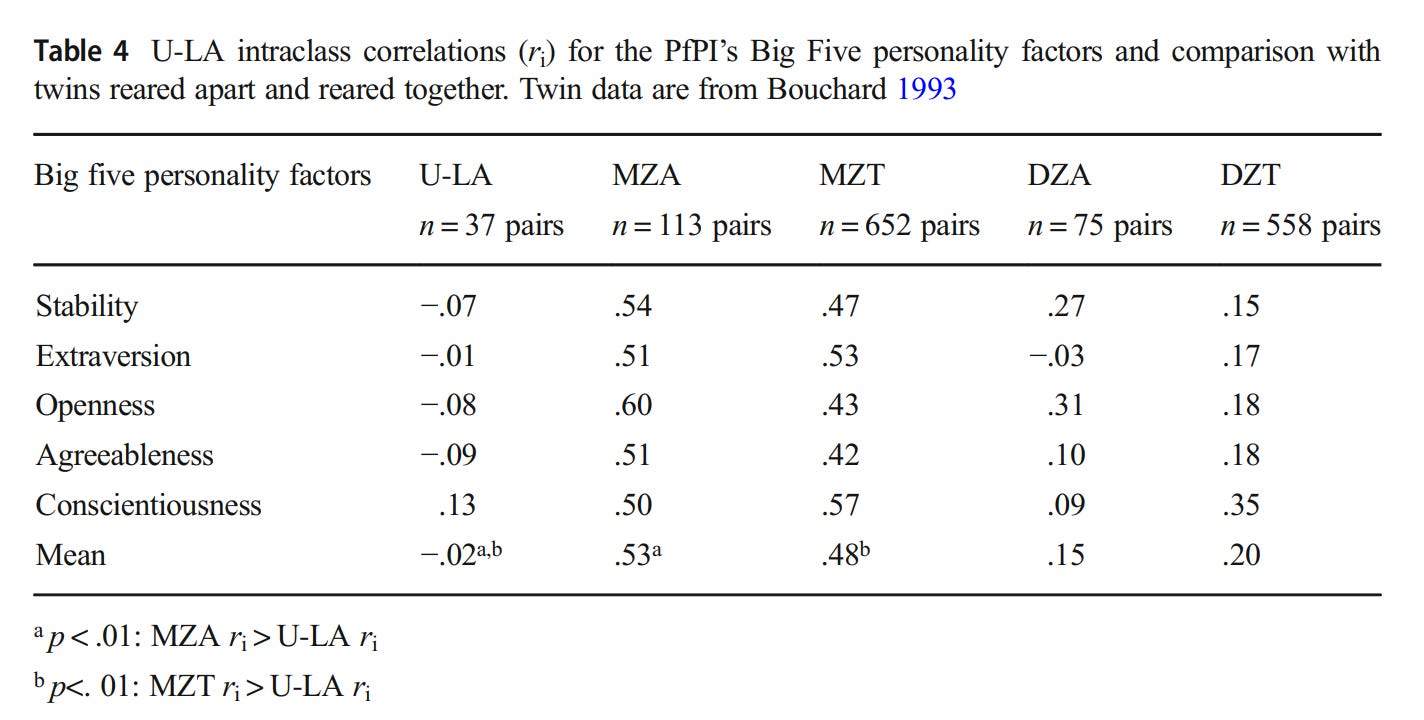
Although it would be foolish to dispute that it’s better to be attractive than unattractive, appearance and psychological traits correlate weakly, and even if they really are correlated, it’s unclear if the causality goes from attractiveness to traits; said similarity could be due to underlying physiological or genetic factors.
Equal Environments Assumption
Of all of the biases that potentially affect twin studies, the most discussed biased of all is the equal environments assumption (EEA), which assumes that MZ twins are as similar in environment as DZ twins for a given trait.
One of the mechanisms by which this is expected to occur — differential treatment by appearance6 — has already been discarded. As such, the other mechanism by which EEA violations are hypothesized to occur is that identical twins are treated more similarly by others because they are believed to be identical.
Reviews on the assumption have supported its validity7 8 or done so with reticence9.
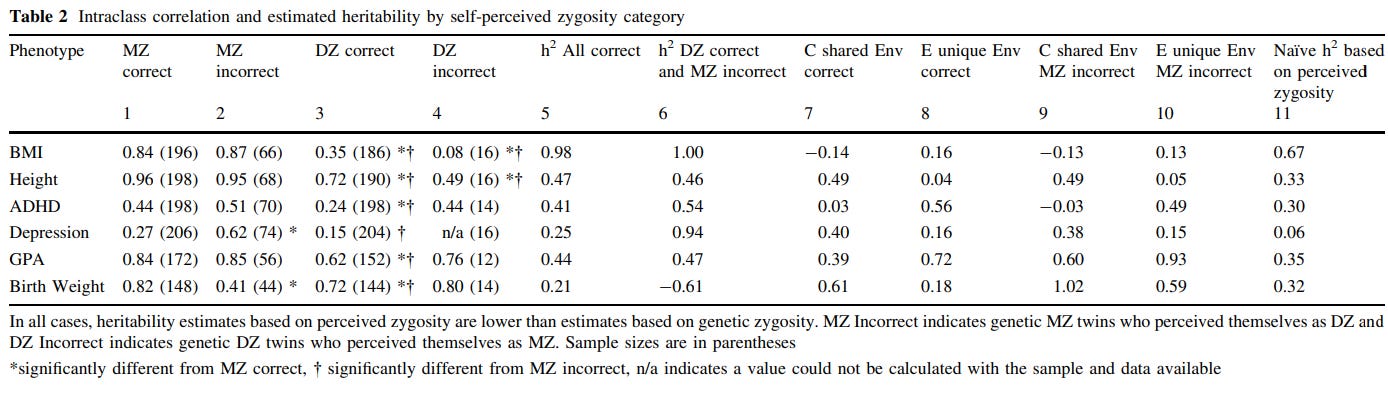
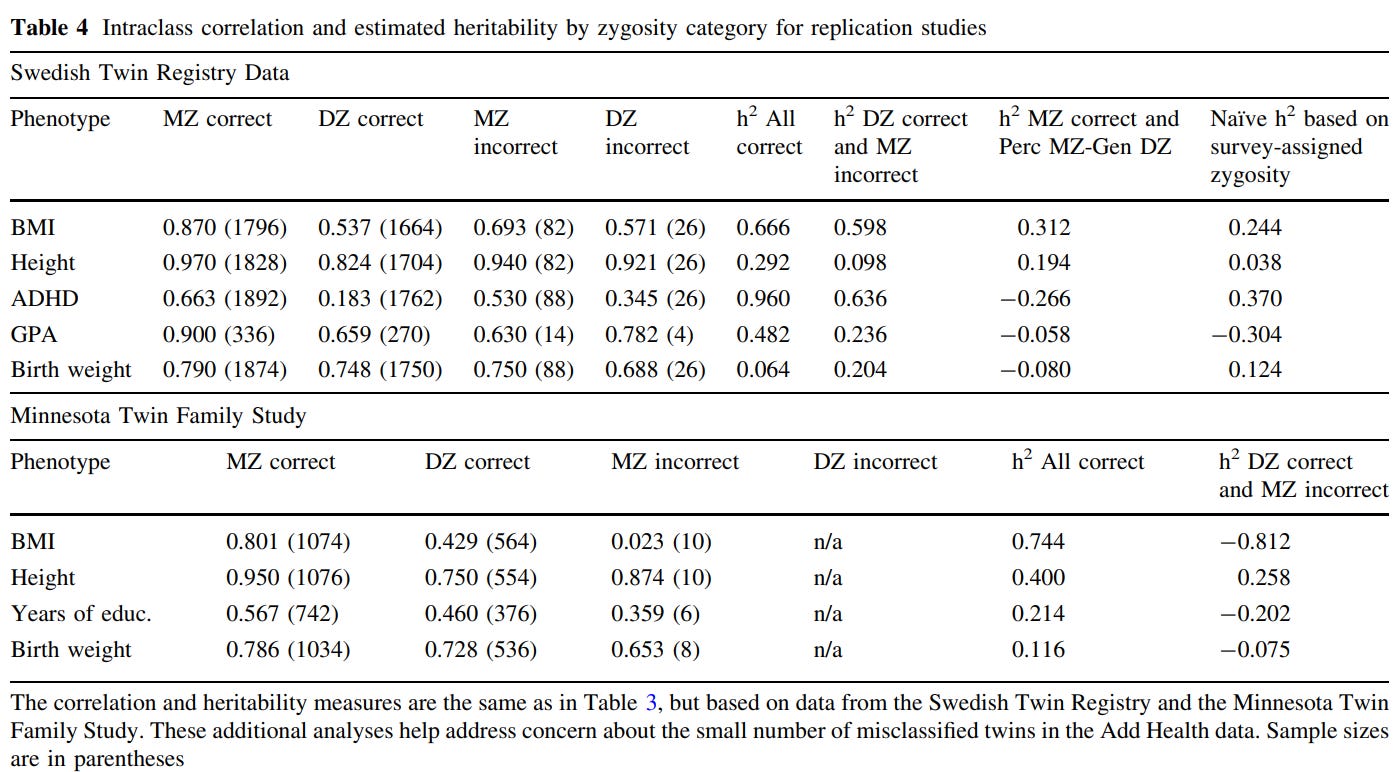
Concretely, there are many methods that are used to test the EEAs validity. One is misclassified twins: although most MZ/DZ pairs are accurate in their belief with regard to whether they are identical or fraternal pairs, occasionally they are incorrect. If environmental similarity caused by social perception resulted in phenotypic similarity, then one would expect twins who believe they are MZ to be more similar in phenotype, and twins who believe they are DZ to be less similar in phenotype. Although this method would be improper for traits related to appearance, as those would be used by the twins to determine their zygosity, it should still be appropriate for psychological or behavioral traits.
The overwhelming of misclassification-based tests of the EEA have supported the validity of the assumption10111213 or supported it to a degree1415, regardless of trait. The best of the six studies I cited is the Conley study, which finds no evidence for the EEA being violated in any of the traits or datasets they checked:
Classically derived estimates of heritability from twin models have been plagued by the possibility of genetic-environmental covariance. Survey questions that attempt to measure directly the extent to which more genetically similar kin (such as monozygotic twins) also share more similar environmental conditions represent poor attempts to gauge a complex underlying phenomenon of GE-covariance. The present study exploits a natural experiment to address this issue: Self-misperception of twin zygosity in the National Longitudinal Survey of Adolescent Health (Add Health). Such twins were reared under one ‘‘environmental regime of similarity’’ while genetically belonging to another group, reversing the typical GE-covariance and allowing bounded estimates of heritability for a range of outcomes. In addition, we examine twins who were initially misclassified by survey assignment—a stricter standard—in three datasets: Add Health, the Minnesota Twin Family Study and the Child and Adolescent Twin Study in Sweden. Results are similar across approaches and datasets and largely support the validity of the equal environments assumption.
There is also indirect evidence that the EEA is valid — for example, correlations between same-sex fraternal twins (mean r = .34) tend to be similar to those of opposite-sex fraternal twins (mean r = .30)16. Surely, if similarity in treatment were to be causal for twin similarity, then opposite-sex twins would not be so alike.
One could question the extent to which misclassifications are to be taken seriously; siblings almost never resemble each other as much as identical twins do. In practice, doctors frequently misclassify twins due to basing their judgements on whether the twins share a placenta (DZ twins always have a placenta for each twin, MZ twins have one placenta 75% of the time). As such, misclassified twins tend to be MZ twins who believe they are DZ; the base rate for misclassification in all twin pairs is about 4-19% depending on the sample17. It’s also not inconceivable that the misclassification rate is inflated by dishonest or incorrect responses, which would reduce the power of the method and attenuate the size of observed violations of the EEA. There is also the issue that twins may base their beliefs about zygosity on their phenotypic similarity, meaning that observed EEA violations may indicate the assumption is still valid.
There are also tests of the EEA that regress similarity in treatment, social environment, frequency of social contact, or physical appearance onto similarity in phenotype. This method has clear shortcomings: nulls can be blamed on the particular choice of independent variables or phenotypes (e.g. similarity in peers, not parental treatment, might have more to do with drug use). Positive findings could also be blamed on reverse causality: if twins' similarity in personality is causal for similarity in peers but not vice versa, then this test would mistakenly find the EEA assumption invalid.
Empirically, Finnish twins who spent more time together were more similar in neuroticism and extraversion1819. Of those tests that use the regression method, one finds that similarity in alcohol use is predicted by time spent together and sharing friends who drink within men; attractiveness and sharing friends who drink predict it within women20 (Horwitz et al., 2003). This is hardly surprising, as peer effects of drug use have been studied and positive effects are typically found.
One paper critical of the EEA came from Bingley et al21, who found low estimated heritabilities (~10%) for education, earnings, and assets after employing a pedigree model using in-laws and extended family relationships that does not make the EEA assumption; using a classical twin model increases the heritabilities to regular values (40-60%). After reading the study, I cannot trust the results due to several factors22.
GxE interactions
The results of twin studies have also been criticized on the basis that genes and environments can interact. It is important to distinguish between two types of interactions here: statistical and commonsensical. Statistical interactions occur when the effect of trait A on trait C varies at levels of trait B, and commonsensical interactions occur when traits A and B are necessary for trait C to exist. Commonsensical interactions are not typically cited as evidence that heritability is not computable, as heritability assesses the degree to which genes explain variation in a trait, not the expression of one23.
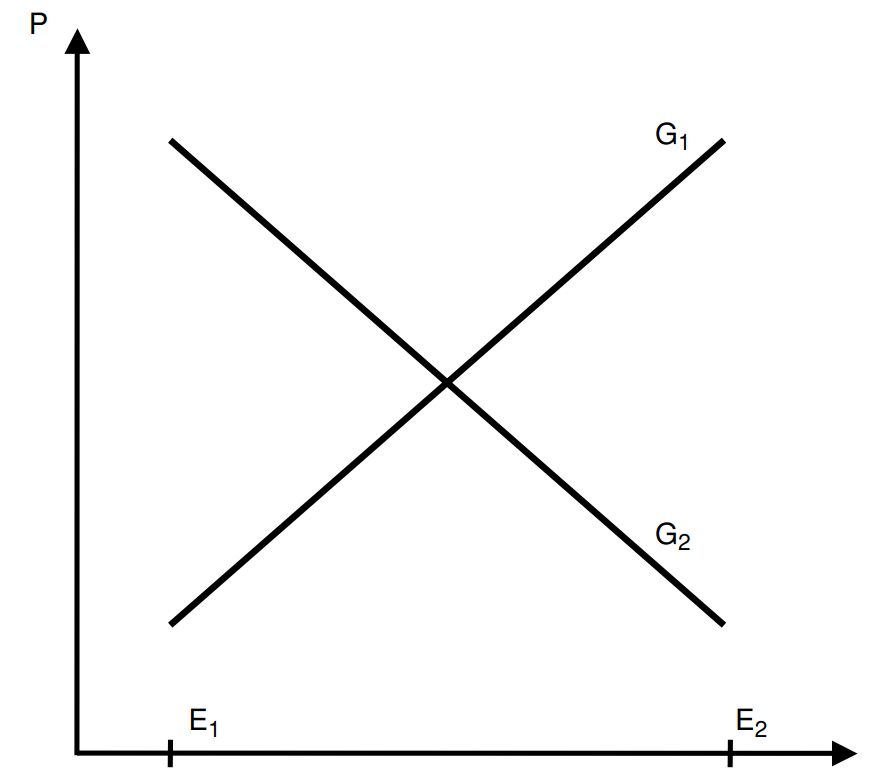
Statistical interactions, on the other hand, if existent and large in magnitude (like the one in the previous figure), make differentiating between genetic and environmental effects less useful in terms of causal inference. There are some examples of interactions that approach this strength: the effect of glasses on eyesight varies substantially by a person’s eye shape, obesity is also rarely observed in pre-industrial societies. However, these are fairly obvious and intuitive examples, and the existence of a non-zero heritability of eyesight deficits and obesity is nonetheless uncontroversial.
Empirically, evidence for GxE being large in magnitude is lacking. Khan et al (2021)24 attempted to assess whether the heritability of 13 outcome variables varied according to three environmental variables: waist-to-hip-ratio, smoking, and exercise. They found that 1-7% of the variance in the outcome variables could be explained by GxE, whereas genetic effects explained 10-70% of the variance. It must be noted, as all traits are heritable, that none of the three variables should be considered environmental and that the findings of this study could be interpreted as weak evidence for epistasis rather than GxE. Similarly, Pazokitoroudi et al. (2024)25 found a GxE to additive heritability ratio of 6.8%, implying that additive factors dominate. Oh, and I should at least mention that the Scarr-Rowe effect is a meme.
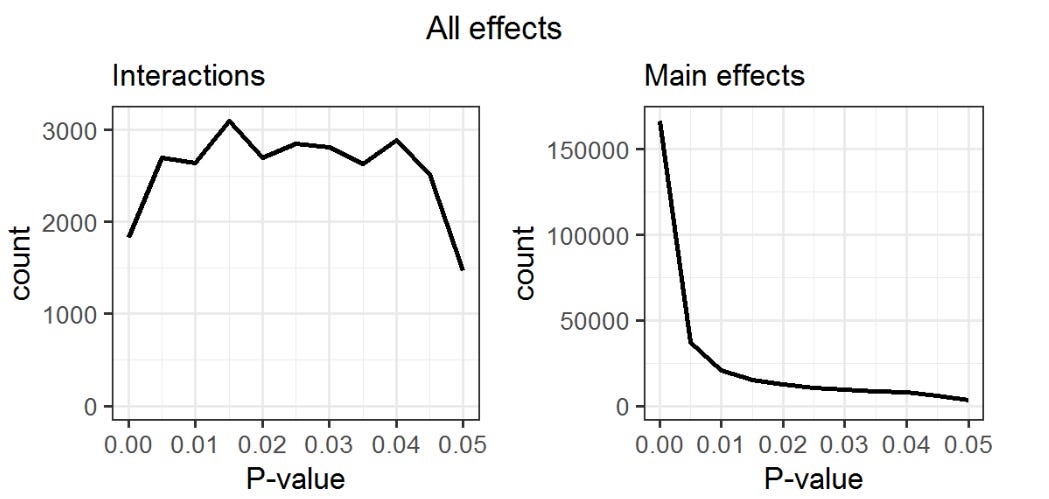
At the trait level, Pallessen26 found that interactions rarely replicate due to their rarity — main effects are about 10x more common in the OKCupid dataset than interactions, according to this p-curve:
Another concern is that the presence of statistical interactions between genetic and environmental factors could inflate heritability estimates. This is correct; in twin models, interactions between the genes and shared environmental factors will be assigned to the additive genetic component, as MZ twins share all of these interactions and DZ share half27.
Epistasis
Espistasis increases heritability estimates from classical twin studies relative to true heritability because monozygotic twins share all genetic interactions, while fraternal twins will share few, which magnifies the difference in the correlation between identical and fraternal twins.
It’s very difficult to test how much epistasis matters in polygenic traits; there are 499,500 potential interactions between 1,000 genes. Empirically, evidence for epistasis has been found in eye colour.
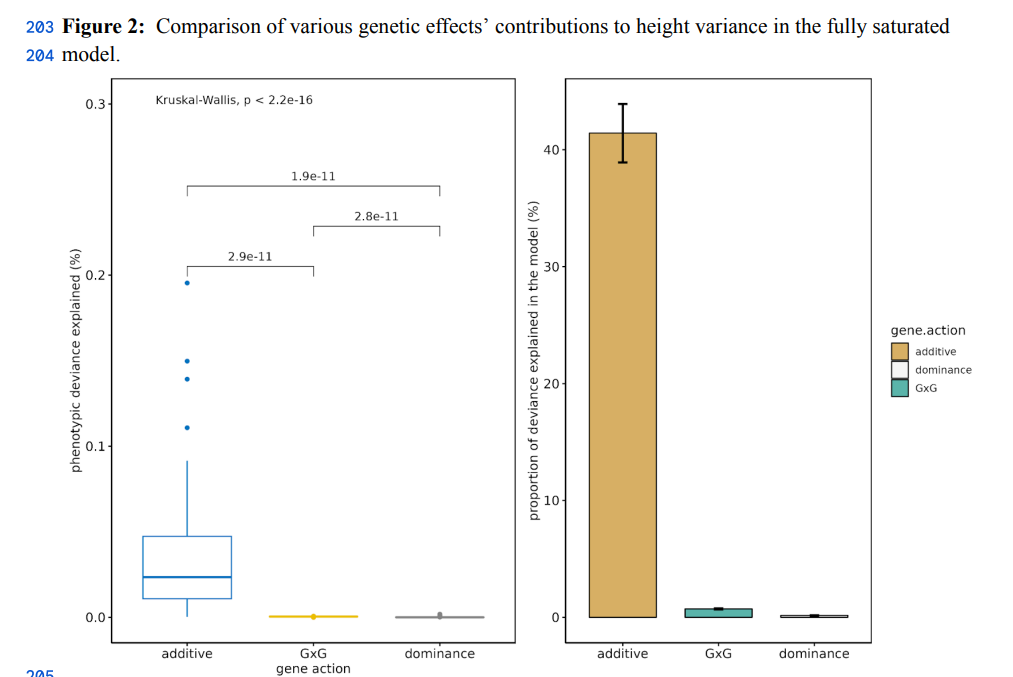
People have tried to find evidence for it in height, with no cigar:
Jabal, Reza & Holmes, Michael & Hinds, David & Auton, Adam & Fontanillas, Pierre. (2024). Analysis of 3.6 million individuals yields minimal evidence of pairwise genetic interactions for height. 10.1101/2024.08.15.608197.
Adult height is a highly heritable polygenic trait with heritability attributable to thousands of independent variants. Large-scale studies have been able to detect genetic variants with contributions to height in the range of approximately 1.2 millimetre per allele copy on average. Non-additive genetic interactions may, in part, account for the difference between broad-sense and narrow-sense heritability estimates. However, prior studies have failed to identify variants with non-additive effects, possibly due to the lack of statistical power. Leveraging 3.6M individuals of European genetic ancestry in the 23andMe research cohort, we performed a genome-wide analysis study (GWAS) to select 1,063 independent common SNPs associated with height (p-value < 5e-8), and then screened for evidence of non-additive effects by analysing 564,453 models including a pairwise SNP-SNP interaction term. We identified 69 pairwise models with suggestive evidence of SNP-SNP interaction (p-value < 1e-4) and, for each SNP pair, we evaluated a fully saturated model including additive, dominant, and epistatic (additive-by-additive, additive-by-dominance and dominance-by-dominance) terms. We tested for the presence of epistatic interactions by comparing models with and without epistatic terms using a likelihood ratio test. Assuming a strict Bonferroni-corrected threshold of 8.9e-8 (0.05/564,453), we found no evidence of epistatic interactions (Likelihood ratio test (LRT) p-value < 9e-07 for all models). Our analysis rules out the existence of epistatic interactions between alleles of >1% frequency with effect sizes larger than 2.42mm. Our large-scale analysis provides further evidence of the minimal contribution of non-additivity in the genetic architecture of adult human height.
As in the case of GxE interactions, interactions are more rare than weak effects, so they should be considered rarer based on priors. However, I think that epistasis is likely to be important (>10% of variance) for the following traits:
Beauty: based on ratios and symmetry, which are functionally interactive.
Productivity: the right personality for a detective and a rapper are not the same. The kind of genes that make somebody a rapper are best combined with the ones that make one good at it.
Overall health: the body is a system. When one part of the system stops working, the other parts might pick up the slack… Or not.
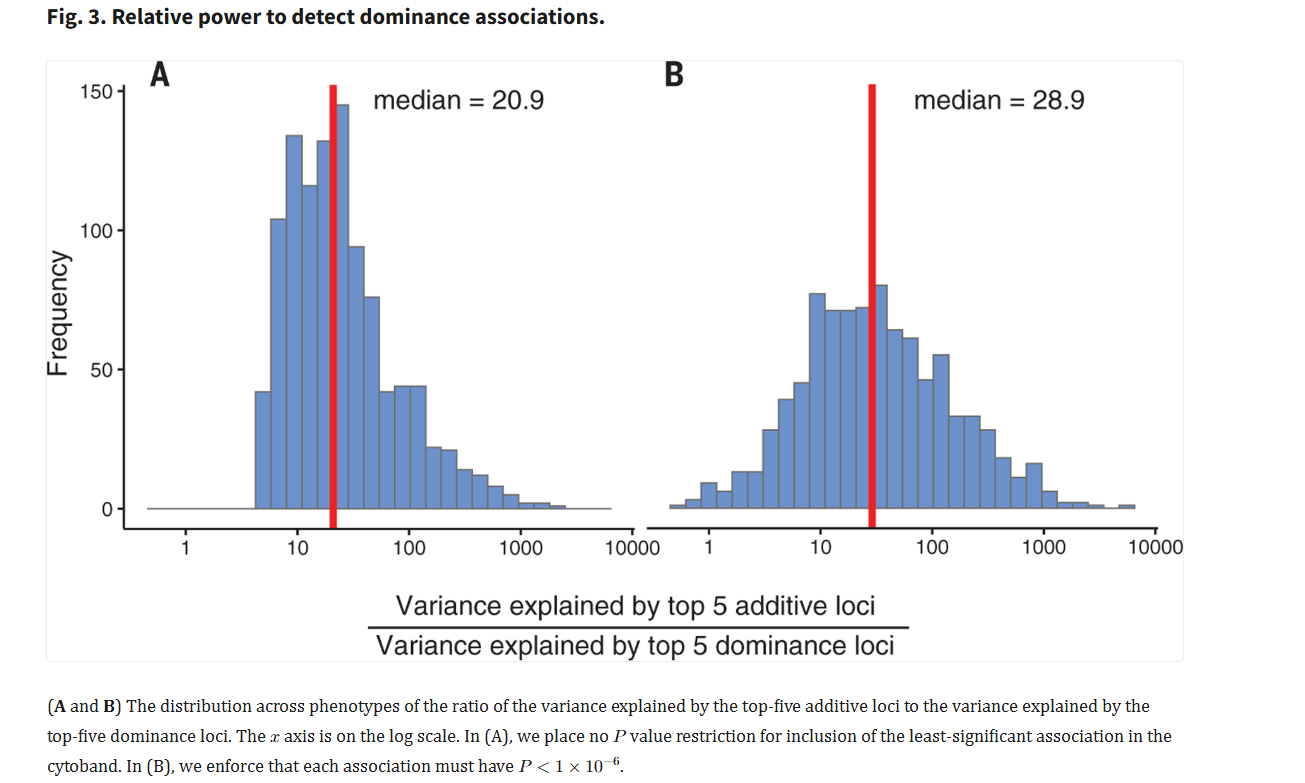
Dominance
Has been tested for in polygenic traits and is secondary to additive variance.
One study of 6715 individuals finds that additive effects explained 5 times as much heritability as dominant ones:
Zhu, Z., Bakshi, A., Vinkhuyzen, A. A. E., Hemani, G., Lee, S. H., Nolte, I. M., … Yang, J. (2015). Dominance Genetic Variation Contributes Little to the Missing Heritability for Human Complex Traits. The American Journal of Human Genetics, 96(3), 377–385. doi:10.1016/j.ajhg.2015.01.001
For human complex traits, non-additive genetic variation has been invoked to explain "missing heritability," but its discovery is often neglected in genome-wide association studies. Here we propose a method of using SNP data to partition and estimate the proportion of phenotypic variance attributed to additive and dominance genetic variation at all SNPs (hSNP(2) and δSNP(2)) in unrelated individuals based on an orthogonal model where the estimate of hSNP(2) is independent of that of δSNP(2). With this method, we analyzed 79 quantitative traits in 6,715 unrelated European Americans. The estimate of δSNP(2) averaged across all the 79 quantitative traits was 0.03, approximately a fifth of that for additive variation (average hSNP(2) = 0.15). There were a few traits that showed substantial estimates of δSNP(2), none of which were replicated in a larger sample of 11,965 individuals. We further performed genome-wide association analyses of the 79 quantitative traits and detected SNPs with genome-wide significant dominance effects only at the ABO locus for factor VIII and von Willebrand factor. All these results suggest that dominance variation at common SNPs explains only a small fraction of phenotypic variation for human complex traits and contributes little to the missing narrow-sense heritability problem.
Beyond educational attainment, dominance has been tested for in the UK Biobank:
In statistical genetics, dominance is a deviation from an additive genetic effect on a trait and is well documented in model organisms, particularly in the context of measures of "fitness," and in plant and animal breeding. In humans, however, evidence of nonadditive genetic effects on complex, polygenic traits is sparse. We looked for evidence of nonadditive effects in more than 1000 phenotypes in the UK Biobank population cohort (𝑁=361,194). To test for "dominance heritability," or the aggregate contribution of nonadditive genetic effects to trait variance genome-wide, we introduce dominance linkage disequilibrium (LD) score regression (d-LDSC). Our method builds upon existing software to include nonadditive effects site by site.
We identified 183 phenotype-locus pairs at genome-wide significance (𝑃<4.7×10⁻¹¹). We replicated known associations for phenotypes with dominant and recessive patterns of inheritance, for example, hair color at the MC1R locus. Qualitatively, we observed stronger nonadditive effects in instances where additive effects are large or the underlying genetic architecture is concentrated in a few loci. The power to detect nonadditive loci was low: We estimate that around a 20- to 30 -fold increase in sample size is necessary to capture evidence of dominance effects similar to that observed at additive loci. Applying LDSC and d-LDSC to 1060 traits, we confirmed strong evidence of additive heritability (700 traits, 𝑃<4.7×10⁻⁵). Despite analyzing a much larger collection of traits with increased power over existing studies, we found little evidence of dominance heritability. We introduced dominance fine-mapping to pinpoint causal variants in the presence of a dominance signal. Gains in fine-mapping resolution due to the rapid decay of dominance LD compared with additive LD are generally outweighed by weaker association signals.
They did find evidence for dominance, but the effect of additive genes was clearly much larger. On average, the most impactful additive genes matter about 20x more than the dominant ones for the average trait:
I am compelled to mention that no evidence for dominance was found in the latest EA GWAS, though I have doubts about the result:
In meta-analyses of the expanded 23andMe sample and the UK Biobank (UKB)3, we also conduct an updated GWAS of the X chromosome (N = 2,713,033) and the first large-scale ‘dominance GWAS’ (i.e., a SNP-level GWAS of dominance deviations) of EA on the autosomes (N = 2,574,253). In our updated X-chromosome GWAS, we increase the number of approximately uncorrelated genome-wide-significant SNPs from 10 to 57. Our dominance GWAS identifies no genome-wide-significant SNPs. Moreover, with high confidence, we can rule out the existence of any common SNPs whose dominance effects explain more than a negligible fraction of the variance in EA. Table 1 summarizes the GWASs conducted in this paper and compares them to previous large-scale GWASs of educational attainment.
I should note that extended family data does not support the hypothesis that most genetic variation in traits is wholy additive, but I think it’s tenable to think that most genetic variation in humans is due to additive factors.
Age, cohort, and sex effects
Competent typically researchers control for these, directly using regression, or indirectly by pooling samples by age or sex. They are also very easy to test for. I do recall one example of a book in the 30s finding that MZ/DZ twins were roughly equivalent in cognitive ability before controlling for age, but after controlling for age they found that MZ twins were much more similar than DZ twins.
Chorionicity
Fraternal twins always have different chorions, while identical twins have the same chorion about 75% of the time. Some have hypothesized that the greater similarity between identical twins in comparison to fraternal ones may be a function of their more similar prenatal environments.
This has been studied extensively, and it appears that chorionicity has very little impact on similarity between twins:
Measurement error
Measurement error does attenuate reliability estimates and most researchers do not control for it. Fortunately, it is easy to correct for using mathematics or structural equation models.
Most traits (e.g. BMI, height, IQ) are measured accurately and corrections for attenuation in these cases are superfluous, though I cannot say the same for traits like personality or self-evaluations of health.
Assortative mating
Assortative mating decreases heritability estimates because it causes DZ twins to be more similar in comparison to what would be expected from random mating.
For most traits this is not a big deal, but in a few (e.g. educational attainment, political views), controlling for it is a must.

Like in the case of measurement, this is easy to correct for with mathematics.
Zygosity misclassification
Researchers usually classify twins with a composite of predictors, such as fingerprints, appearance, blood markers, machine learning, questionnaires, and in rare cases genes.
The precise accuracy of these methods is not well known, but I find it hard to believe that misclassification is a problem; the most questionable method of determining zygosity (questionnaires) has an accuracy of 90% to 97%, which would deflate heritability estimates by perhaps a few percent.
Prenatal effects
Critics of twin studies often claim that twin studies overestimate heritability by neglecting to factor in the prenatal environment. I’m not exactly sure why this is, but I do know they are wrong.
Prenatal effects that vary due to mothers differing in their womb environments are captured by the shared environmental component (C) in twin models. Prenatal effects that are unique to a particular pregnancy partition variance from the unshared environmental component (E) to the shared environmental component (C), twins share prenatal environments that would usually differ between siblings.
Twins also compete within the womb for resources, which causes them to differ more in infancy in comparison to what would be expected from genes; this causes twins to be slightly less intelligent and tall in comparison to the general population. Fortunately, these differences decrease with age and do not substantially affect the estimation of heritability.
Twin-specific effects
A twin-specific effect is an effect that causes them to be more similar or distinct from each other in comparison to what would be expected from the genes and family environment they share. Twin-specific effects that cause similarity that are not accounted for by modeling inflate estimations of the shared environment; those that decrease similarity inflate the unshared environment.
They cannot be tested for in conventional twin models, but can be added to pedigree models. Some of these find positive effects (twins are more similar to each other in comparison to what would be expected) and others find negative effects (less similarity).
Not sure what to make of this, but it leads me to believe that they are not a big deal.
Somatic mutations
On average, MZ twins differ on average by 5.2 early-development mutations, so it’s unlikely that they bias heritability estimates by more than a fraction of a percentage. MZ correlations also tend to not change with age, which suggests that mutations do not attenuate heritability estimations by a practically significant amount.
Parenting
Twin studies capture variance due to parental effects through the C and E components: C captures the effects that are shared by both siblings and E captures effects that are not shared by siblings. It is true that these models do not estimate exactly how much parenting has an effect, but the environmental component of the twin model does capure environmental variance that occurs due to effects of parents on children.
Epigenetics
Nobody knows what they do lol.
Cultural transmission
Only brought up as a bias by people who do not understand how the models work.
Variance in cultural transmission is partitioned into the C component if siblings share the same cultural influences, and is partitioned into the E component if they do not share them. It’s literally that simple.
Portability of heritability estimates to other times/places
If this was a big problem, people would talk about it. Given that people do not talk about it, I must infer that it is not a big problem. It’s also not a bias in the traditional sense of the word.
Also relevant:
The heritability of height is similar in asians and whites.
The heritability of income is similar in the US, Australia, and Scandinavia
Basically every other study says the same thing from my memory, except for education (increased in recent years) and lifespan (increased in recent years). I suspect the heritability of political orientation is higher now than it was in the past due to online politics, but I’m not entirely sure.
Selective sampling
Restriction of range can cause both genetic and environmental restriction and can increase or decrease heritability estimates depending on whether the restriction is relatively genetic or environmental. There's also semi-representative samples of twins/adoptees (e.g. that sample of all Scottish twins) that find the same things that the normal ones do.
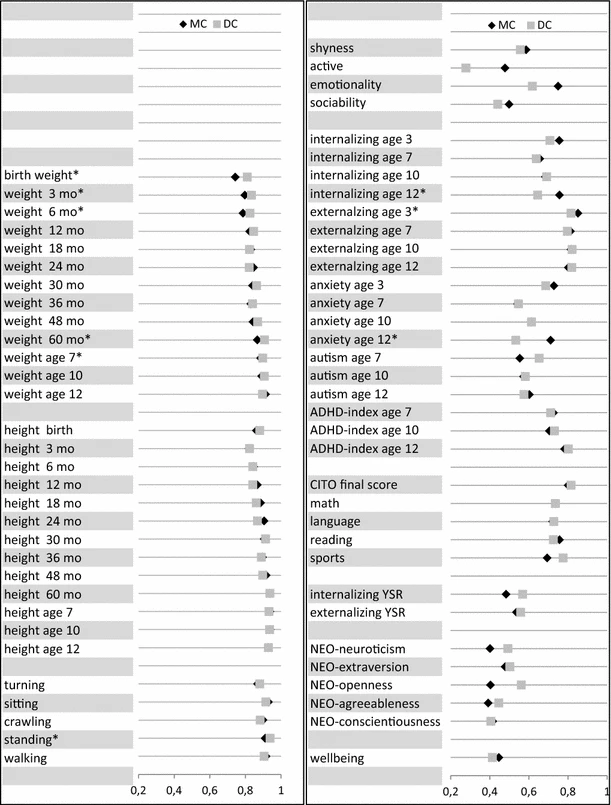
Assumptions in extended family and adoptee models
Like in the case of twin studies, extended family and adoptee models also make many assumptions; I will not go as many details as I did with twins, but I will cover them briefly. Some assumptions (e.g. absence of measurement error) are shared with the twin designs while others (e.g. no environmental similarity between cousins) are not. I can still do the due diligence of posting the assumptions that adoptee/extended family models make:
I’d say that these models overestimate heritability on average, but in practice people tend to find that they come to similar conclusions that twin models do, evidenced by the fact that they are all lumped into the same category: pedigree models.
Predictably, nurturists don’t like these designs either, mainly because they think that the similarity of pairs (e.g. identical twins reared apart, cousins, parents/children) is due to environmental similarity. And this is true — adopted first cousins correlate at 0.05 in cognitive ability, despite not sharing genes or the same house:
Given that normal cousins correlate at 0.2 in cognitive ability, only 25% of the similarity between the pair can be explained by the environment. Not much of an issue, and can easily be modelled out by subtracting the similarity between cousins by 0.05 or introducing another component into the model. Half-siblings who share a mother are only ~.06 more similar than half-siblings who do not, meaning that prenatal environment doesn’t explain much variation in intelligence; moreso when you consider that half-siblings who share a mother are probably reared together more often.
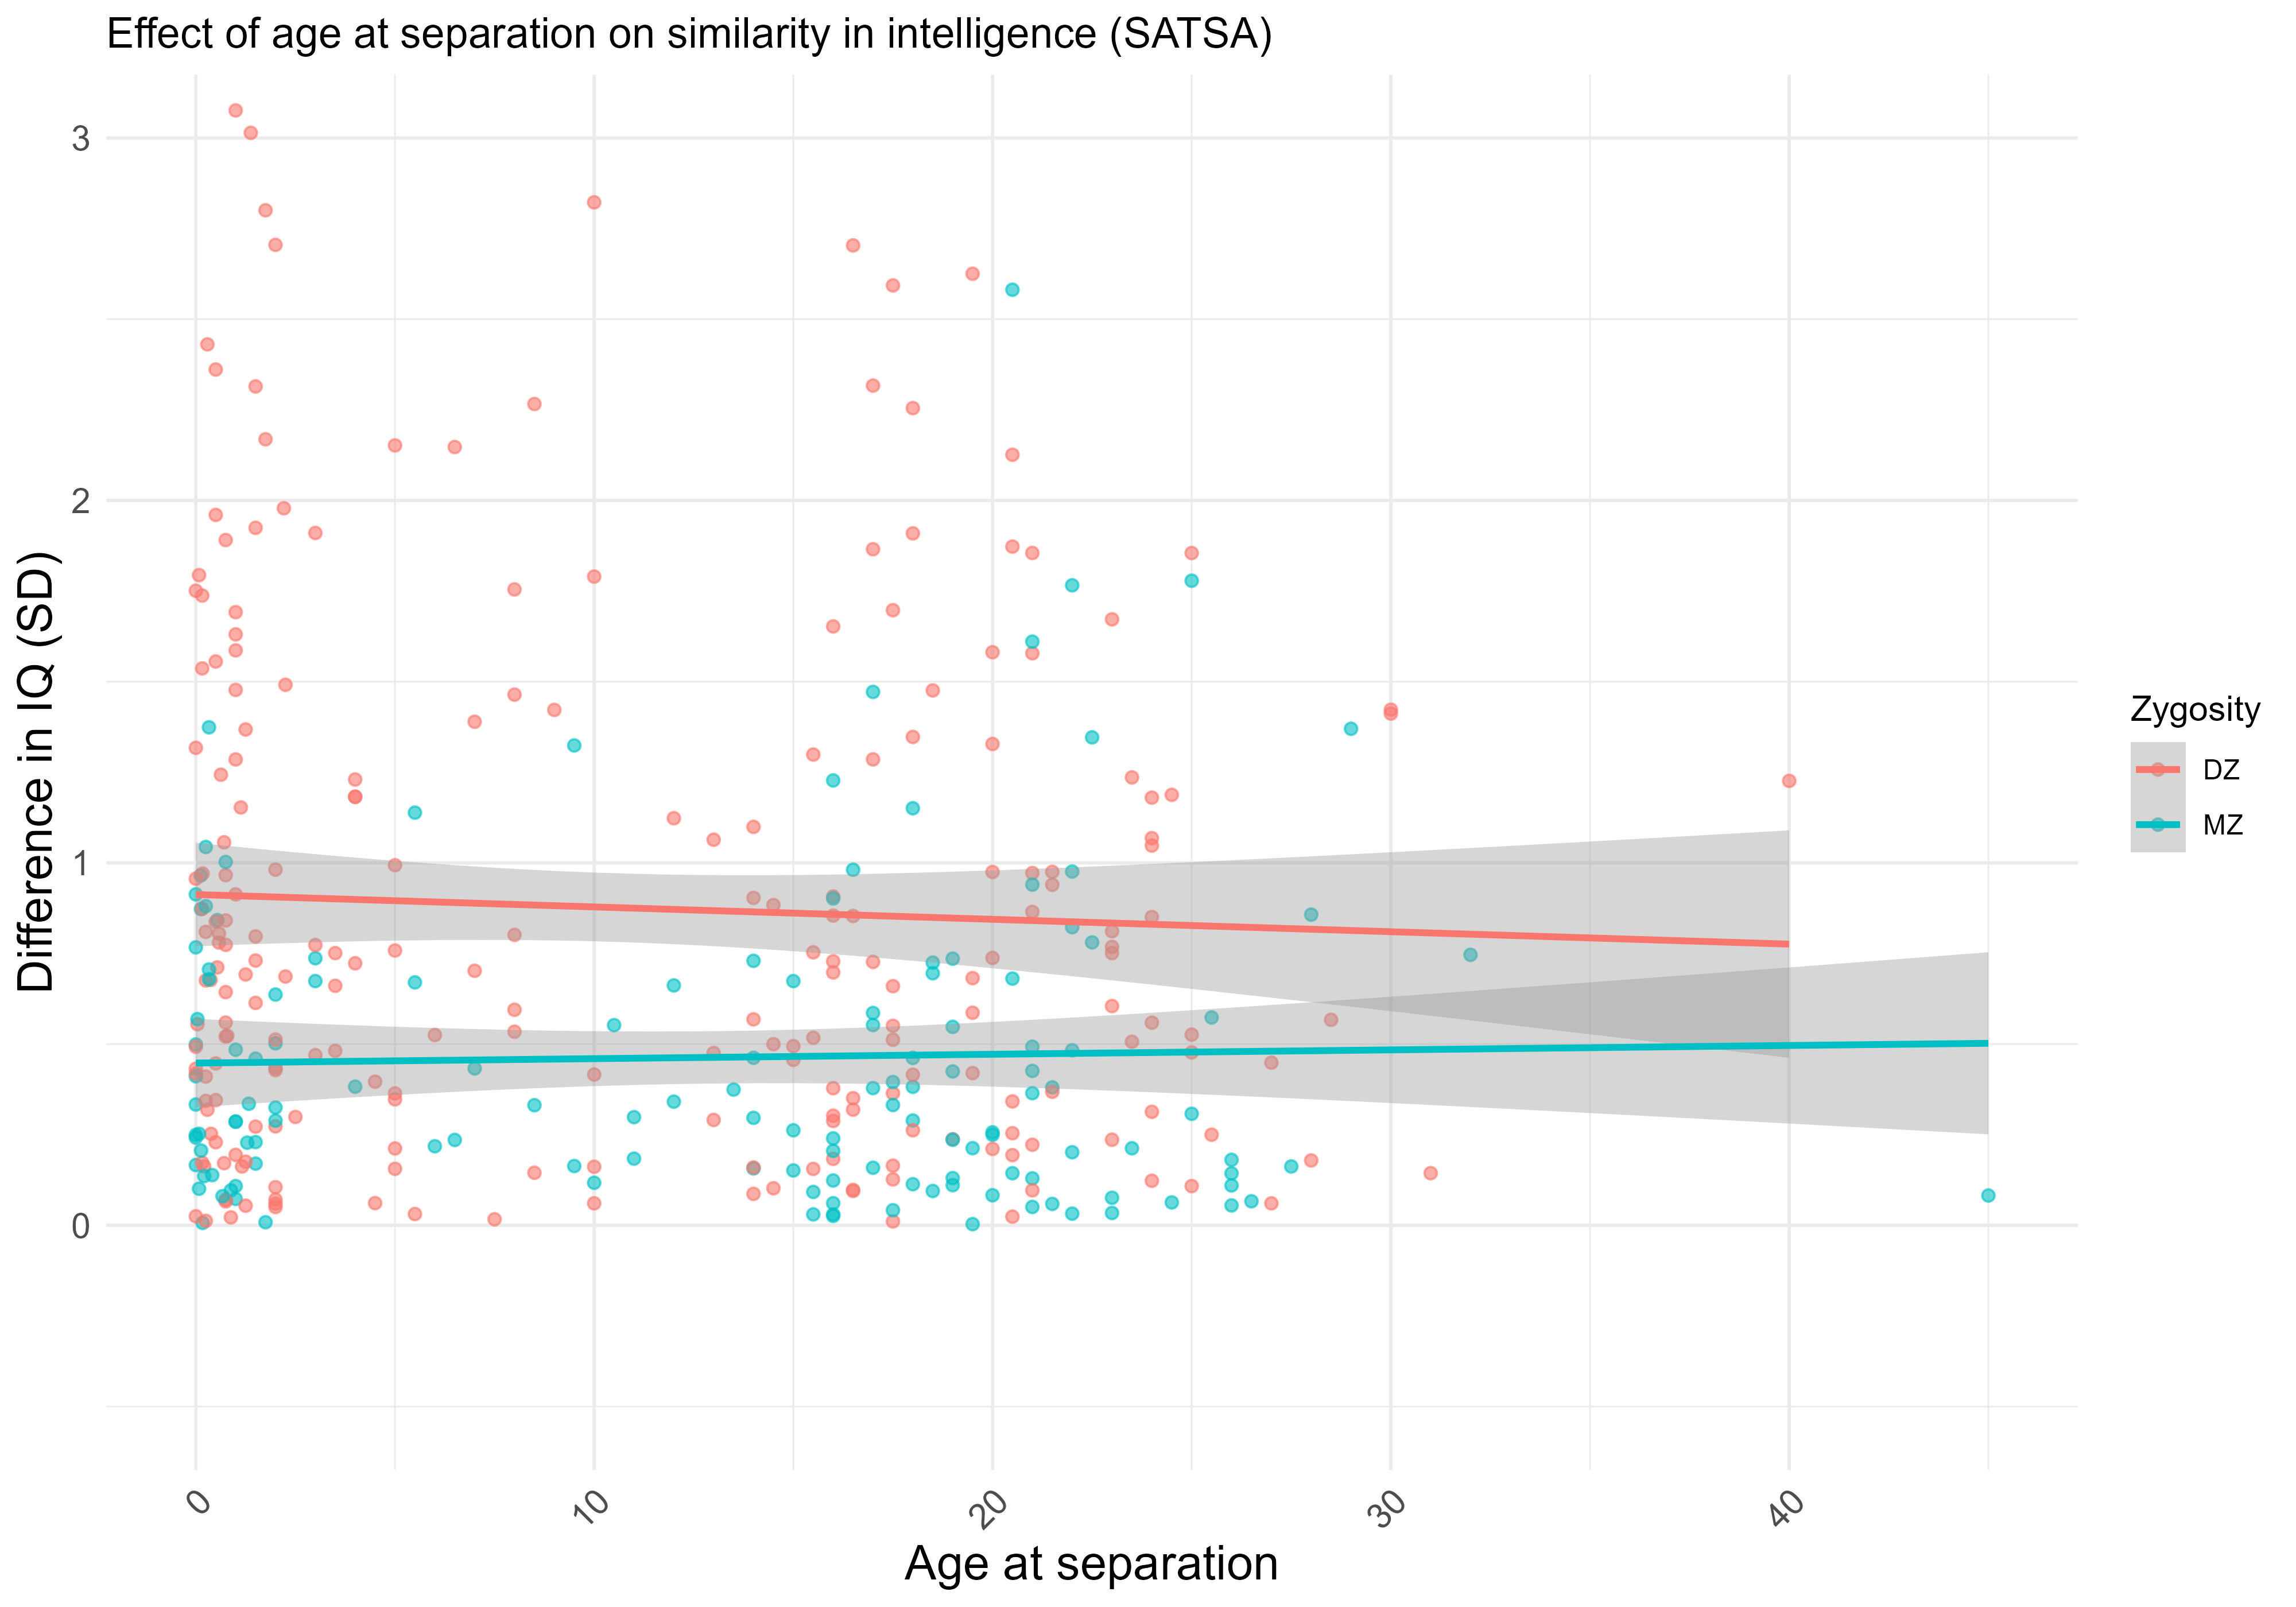
Identical twins that are supposedly reared apart do have some residual environmental similarity: some are reared together until they are 8 years old, some are taken in by their aunts or uncles, and some even spent their lives living in the same neighbourhood. Empirically, I tried to test whether being separated at a later age was causal for similarity in intelligence within the SATSA sample. No cigar:
Age of separation, however, was a statistically significant (p < .01) predictor of similarity in education:
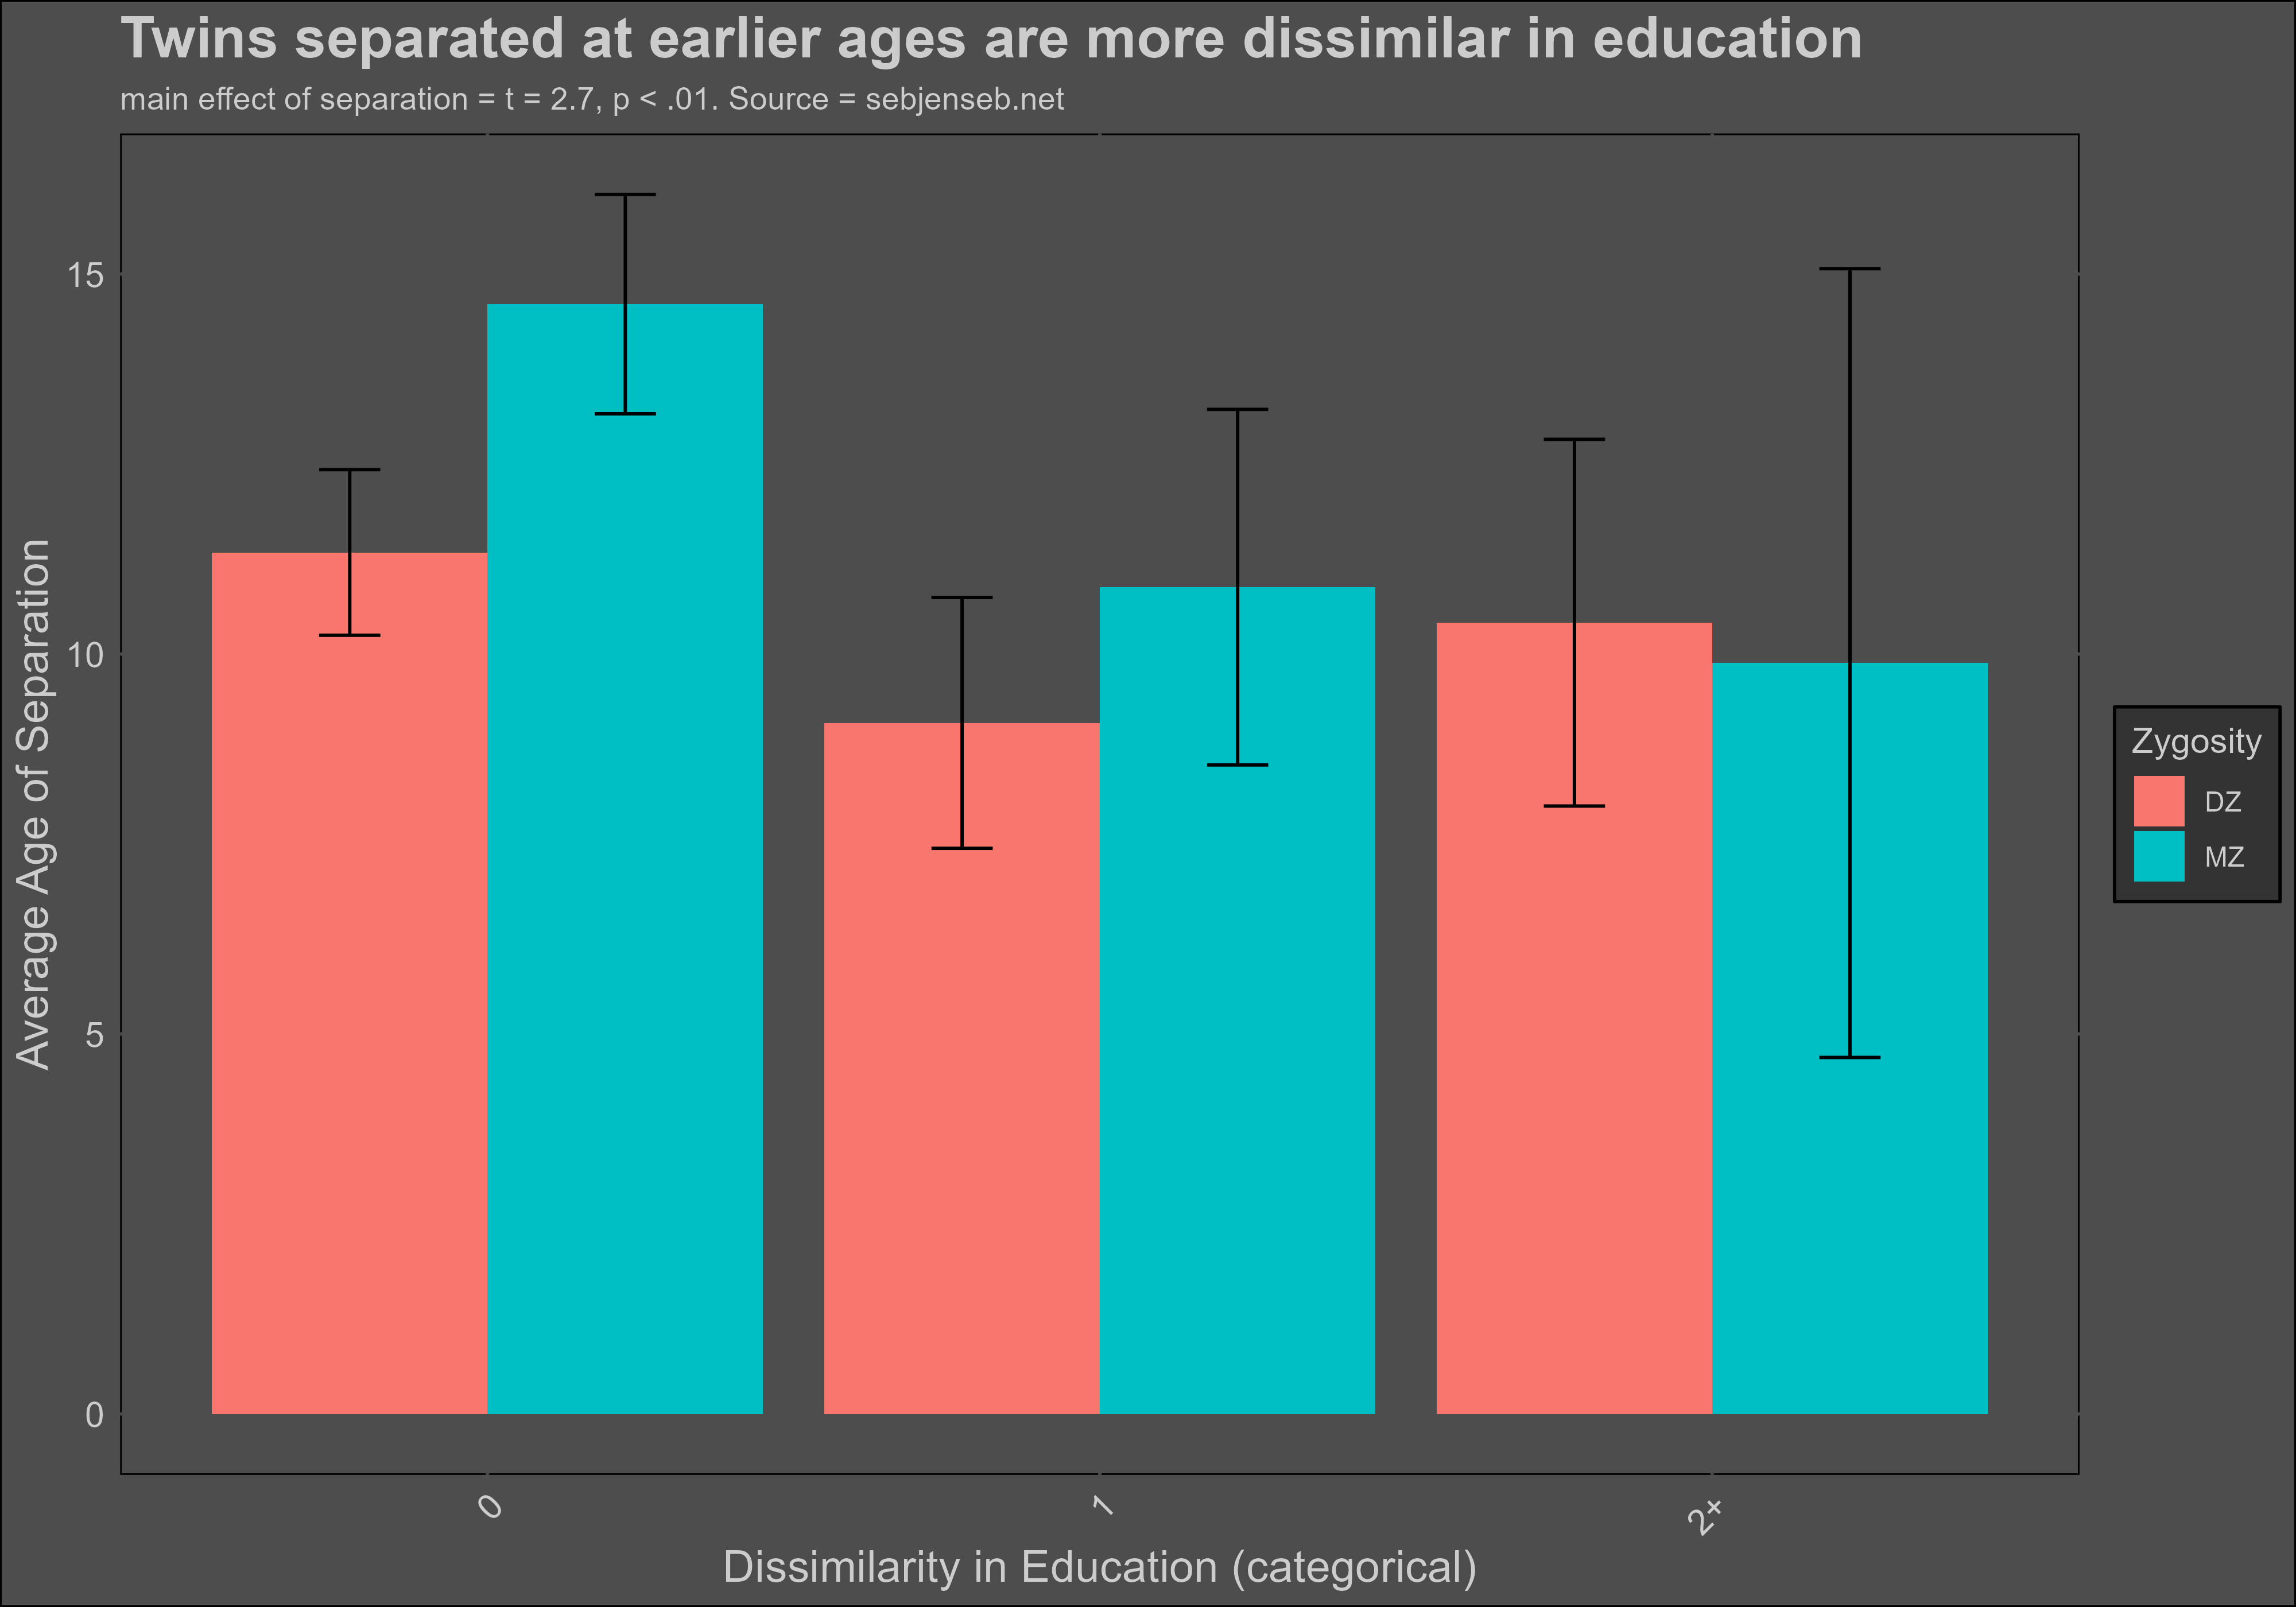
Which is consistent with the results of twin studies: the effect of shared environment on intelligence is small, but for education it is large.
Conclusion
One problem I see in behavioural genetics is that most of the arguments made for hereditarianism (or against it, for that matter) only make sense if you had bought into said framework in the first place. People who think discrimination/appearance really matter aren’t going to accept twin studies because they will think MZ twins being more similar than DZ twins is a function of socially-caused discrimination. Likewise, people who think that children born to rich families are more likely to have X and Y good outcomes because of genes are not going to think that restricting the range of SES in twin/adoption studies is going to matter.
On top of that, most people don’t like numbers or aren’t good at them, even in academia. As such, the norm is for people to judge numbers on the basis of whether they agree with their worldviews. On a related note:
When the postmodern philosophers say things like “there is no truth there is only perspective” or “morality is relative” they aren’t saying “so believe and do whatever you want”.1 They are saying that everyone is already believing and doing whatever they want and are just oblivious to it. It’s not prescriptive, it’s descriptive; not an endorsement of what we should do but a scathing critique of what we are already doing.
Generally I think people who are not experts in the domain of genetics/psychology can be forgiven for having the wrong perspective on the gene question, but people who clearly have read a lot of the literature and are still wrong about it should be appropriately judged and ignored. If there really was some massive problem with twin and adoption studies that rendered them invalid, the massive number of people who hate them would point it out, and they would be adjusted accordingly or scrapped for a different method.
Given this has not happened, and that all the critics do is reheat old talking points that Jensen, Bouchard, and co debunked 40 years ago, I must infer that the nurturist faction of the behavioural genetics field has nothing to say anymore and should be ignored. I’ll lead by example and never mention that guy who works at Harvard ever again.
Further Reading
Concepts, estimation and interpretation of SNP-based heritability (Jian Yang)
Is hereditarianism wrong (East Hunter)
Heritabilities are usually underestimated (Emil Kirkegaard)
Missing heritability: much more than you wanted to know (Scott Alexander)
Meta-analysis of 1250 correlations between family members in phenotypes
Assuming no assortative mating.
Credit to Wolfram, Plomin, Turkheimer, Dalmaijer, Goldberger, Kirkegaard, and Lasker. Note that I do not necessarily agree with other researchers on whether certain biases cause heritability to be under or over estimated.
A = 2x(rmz - rdz), E = (1-rmz), C = residual variance. Alternatively a statistical model can be fit to these components and slightly more accurate estimates can be produced, though they rely on the same underlying logic.
Dunkel and I got roughly the same correlation — mine is .08.
The meta-analysis is useless. The largest and highest quality sample (WLS) shows an unambiguously positive effect independent of IQ.
Since appearance is highly heritable, technically this is an example of reactive GxE, where genes cause people to be attractive which causes them to be treated differently by their environment.
Barnes, J. C., Wright, J. P., Boutwell, B. B., Schwartz, J. A., Connolly, E. J., Nedelec, J. L., & Beaver, K. M. (2014). DEMONSTRATING THE VALIDITY OF TWIN RESEARCH IN CRIMINOLOGY. Criminology, 52(4), 588–626. https://doi.org/10.1111/1745-9125.12049
Lasker, J. (2020). RPubs. The Equal Environments Assumption. https://rpubs.com/JLLJ/EEA
Felson, J. (2014). What can we learn from twin studies? A comprehensive evaluation of the equal environments assumption. Social Science Research, 43, 184–199. doi:10.1016/j.ssresearch.2013.10.004
Conley, D., Rauscher, E., Dawes, C., Magnusson, P. K. E., & Siegal, M. L. (2013). Heritability and the equal environments assumption: Evidence from multiple samples of misclassified twins. Behavior Genetics, 43(5), 415–426. https://doi.org/10.1007/s10519-013-9602-1
Kendler, K., & Robinette, C. (1983). Schizophrenia in the National Academy of Sciences-National Research Council Twin Registry: A 16-year update. American Journal of Psychiatry, 140(12), 1551–1563. https://doi.org/10.1176/ajp.140.12.1551
Goodman, R., & Stevenson, J. (1989). A twin study of hyperactivity—ii. The aetiological role of genes, family relationships and perinatal adversity. Journal of Child Psychology and Psychiatry, 30(5), 691–709. https://doi.org/10.1111/j.1469-7610.1989.tb00782.x
Kendler, K. S., Neale, M. C., Kessler, R. C., Heath, A. C., & Eaves, L. J. (1993). A test of the equal-environment assumption in twin studies of psychiatric illness. Behavior Genetics, 23(1), 21–27. https://doi.org/10.1007/bf01067551
Scarr, S. (1968). Environmental bias in twin studies. Eugenics Quarterly, 15(1), 34–40. https://doi.org/10.1080/19485565.1968.9987750
Rowe, R., Pickles, A., Simonoff, E., Bulik, C. M., & Silberg, J. L. (2002). Bulimic symptoms in the virginia twin study of adolescent behavioral development: Correlates, comorbidity, and genetics. Biological Psychiatry, 51(2), 172–182. https://doi.org/10.1016/s0006-3223(01)01257-4
Polderman, T. J. C., Benyamin, B., de Leeuw, C. A., Sullivan, P. F., van Bochoven, A., Visscher, P. M., & Posthuma, D. (2015). Meta-analysis of the heritability of human traits based on fifty years of twin studies. Nature Genetics, 47(7), 702–709. https://doi.org/10.1038/ng.3285
Conley, D., Rauscher, E., Dawes, C., Magnusson, P. K. E., & Siegal, M. L. (2013). Heritability and the equal environments assumption: Evidence from multiple samples of misclassified twins. Behavior Genetics, 43(5), 415–426. https://doi.org/10.1007/s10519-013-9602-1
Rose, R. J., Koskenvuo, M., Kaprio, J., Sarna, S., & Langinvainio, H. (1988). Shared genes, shared experiences, and similarity of personality: Data from 14,288 adult Finnish co-twins. Journal of Personality and Social Psychology, 54(1), 161–171. https://doi.org/10.1037/0022-3514.54.1.161
Plomin, R., Willerman, L., & Loehlin, J. C. (1976). Resemblance in appearance and the equal environments assumption in twin studies of personality traits. Behavior Genetics, 6(1), 43–52. https://doi.org/10.1007/bf01065677
Horwitz, A. V., Videon, T. M., Schmitz, M. F., & Davis, D. (2003). Rethinking twins and environments: Possible social sources for assumed genetic influences in twin research. Journal of Health and Social Behavior, 44(2), 111. https://doi.org/10.2307/1519802
Bingley, P., Cappellari, L., & Tatsiramos, K. (2023). On the origins of socio-economic inequalities: Evidence from twin families. SSRN Electronic Journal. https://doi.org/10.2139/ssrn.4604424
I note that, in their paper, the correlation between an MZ twin’s twin educational attainment and that of their spouse is 0.3; for DZ twins it is 0.28. These values seem to be unrealistically similar; I note that other scholars have tested for whether assortative mating for education is phenotypic or social in nature, and most have suggested that phenotypic assortment is stronger , with the exception of one that found that were roughly equal in magnitude. The small genetic correlation observed (r = 0.16) in Bingley et al (2023) reduces estimated heritability and is not corroborated by other sources, such as Clark who finds a correlation of 0.53 in underlying social status between spouses in his 2023 PNAS paper.
They also employ a heterogenous shared-environmental model where different relatives differ in their environmental similarity, in total, 14 different shared environmental parameters for 27 different types of kin pairs; such a large number of parameters may result in overfitting. Thus, it would be inappropriate to blame the discrepancy between the estimates from the twin and pedigree model entirely on the EEA being invalid, especially in light of evidence that it is tenable for most traits. It must also be noted that MZ twins being more similar than would be expected from a regular shared environment effect or additive genes could also be interpreted as evidence for epistasis (interactions between genes), as MZ twins share all epistatic variance and other kin pairs would share little of it.
See Sesardic, 2005 — Making Sense of Heritability
Khan, M., Di Scipio, M., Judge, C., Perrot, N., Chong, M., Mao, S., Di, S., Nelson, W., Petch, J., & Paré, G. (2021). A versatile, fast and unbiased method for estimation of gene-by-environment interaction effects on biobank-scale datasets. Cold Spring Harbor Laboratory. https://doi.org/10.1101/2021.04.24.21255884
Pazokitoroudi, A., Liu, Z., Dahl, A., Zaitlen, N., Rosset, S., & Sankararaman, S. (2024). A scalable and robust variance components method reveals insights into the architecture of gene-environment interactions underlying complex traits. The American Journal of Human Genetics, 111(7), 1462–1480. https://doi.org/10.1016/j.ajhg.2024.05.015
Pallessen, J. (2018). RPubs. Interaction Effects. https://rpubs.com/Jonatan/interactions
Gusev, S. (2024). Gene-environment interactions: Ubiquitous yet undetectable. The Infinitesimal. https://theinfinitesimal.substack.com/p/gene-environment-interactions-ubiquitous
Calling the “missing heritability problem” a red herring overstates the degree of convergence between pedigree‐based estimates and modern molecular estimates, and it downplays what the gap actually tells us about genetic architecture, measurement, and inference. At its core, missing heritability is not the claim that twin or adoption studies are “wrong,” but that the portion of trait variance captured by the kinds of variants and models we typically use in genome‑wide analyses does not yet match what family designs imply should be there. That remains scientifically meaningful because it bears directly on biological mechanisms and on the limits of prediction and intervention. It also helps to start from a precise definition: heritability is a variance component defined for a particular population and environment, and SNP‑based heritability (from GREML/LDSC and relatives) is the variance tagged by measured variants under explicit assumptions; not “the percent of a trait caused by genes” in any global sense. The leading methods, their assumptions, and their biases have been dissected in depth for more than a decade; they are neither unexamined nor too new to evaluate.
On what is arguably the best‑measured human trait: height; the field has indeed narrowed the gap, but even this poster child illustrates why “red herring” is too strong. With five‑million–person GWAS, Yengo and colleagues showed that identified common variants now account for nearly all of the common‑SNP component of height, yet they explicitly note that this saturation is largely restricted to European ancestries and does not mean the total pedigree heritability has been fully mechanistically resolved. Whole‑genome sequencing (WGS) analyses that model low‑frequency and rare variants further recover a large fraction of the gap for height and BMI, but those results do not automatically generalize to other traits. These are successes of method and sample size; not evidence that missing heritability was never a real signal.
Once we step beyond height and BMI, the gaps remain informative. For major psychiatric disorders, twin/family estimates are high, while SNP‑based estimates remain much lower even in enormous cohorts. In schizophrenia, population‑based twin data place heritability around ~0.75–0.80, whereas SNP heritability from state‑of‑the‑art analyses is about ~0.24–0.25. Even allowing for ascertainment and modeling choices, this is not a rounding error; it points to genetic contributions that current common‑variant models and genotyping schemes still miss and to modeling differences between designs that matter for interpretation.
A central reason the gap cannot be dismissed is that “what’s missing” is increasingly being traced to specific sources. Rare and low‑frequency coding variants with effect sizes an order of magnitude larger than typical GWAS hits contribute to height and other traits; rare variants also account for a substantial share of cis‑heritability of gene expression. These observations are not pedantic quibbles about arcane methods—they tell us that much biologically relevant variance sits in alleles poorly tagged by SNP arrays and standard imputation, so array‑based GREML will undercount them by design. Emerging work on structural variants (copy‑number changes, complex rearrangements) and tandem repeat variation points the same way: they are common, can exert large functional effects, and are only now being measured at scale with long‑read sequencing and specialized genotyping, including in schizophrenia where repeat burden and high‑risk CNVs (for example, 22q11.2 deletions) materially affect liability. If missing heritability were a red herring, we would not repeatedly see variance reappear as soon as technologies and models expand to capture these classes of variation.
It is also inaccurate to suggest that molecular methods stand or fall on “tenuous” assumptions that have gone unexamined. The very concerns listed, LD mismatch between markers and causal variants, MAF‑dependent tagging, and assortative mating, are explicitly modeled in modern pipelines. GREML‑LDMS stratifies by LD and minor‑allele frequency to address incomplete tagging and shows how including rarer and lower‑LD variants raises h² estimates toward pedigree benchmarks when those variants are present; WGS‑based GREML generalizes this even further. Assortative mating, long‑range LD, and population structure are now recognized to bias marker‑based estimators and polygenic scores, and there is an active literature quantifying and correcting those biases, including through within‑family GWAS designs that reduce indirect genetic effects and stratification. That body of work shows attenuation of effect sizes within sibships, evidence that some of what looks “genetic” in population samples is a mix of direct and indirect processes, not that the molecular estimators are untrustworthy or that the questions they raise should be ignored.
Likewise, indirect genetic effects (“genetic nurture”) are not merely artifacts of assortative mating. Trio‑based and family‑based designs show that non‑transmitted parental alleles measurably affect offspring outcomes via the environments parents provide, with within‑family GWAS strengthening the inference about direct effects by shrinking population‑level signals. More recent work indicates that some indirect effects operate beyond the nuclear family and cannot be dismissed as simple assortment alone. The magnitudes vary by trait and cohort, but the phenomenon is robust enough that ignoring it inflates naive between‑family estimates and blurs the meaning of “genetic effect” in social and behavioral traits.
Nor is it convincing to claim “portability” is a nonissue because “people don’t talk about it.” They do, and with urgency. Polygenic scores trained in European‑ancestry samples lose much of their predictive accuracy in non‑European populations, which has been widely documented and remains a practical manifestation of missing heritability for most of the world’s people. This is precisely why the height map “saturation” result emphasizes ancestry limitations. Beyond ancestry, gene–environment interplay also limits portability: meta‑analyses find that the expression of genetic differences in cognitive outcomes is moderated by socioeconomic context, with stronger genetic effects in environments where basic resources and schooling are less constraining (a pattern especially visible in U.S. cohorts and weaker in Western Europe). All of this underscores that heritability is contingent and that gaps at the molecular level often track contingent features of sampling, technology, and environment rather than vanishing upon closer inspection.
Finally, appeals to the Equal Environments Assumption (EEA) as globally “settled” overlook both the logical limitation of misclassification tests and the empirical nuance across traits. Even sympathetic reviews acknowledge that while much evidence is consistent with the EEA, measures of environmental similarity are often coarse and some violations would push twin‑based heritability upward for social and behavioral outcomes. The right conclusion is not that twin studies are “mere statistical tomfoolery,” but that their estimates answer a different question: broad‑sense familial resemblance under assumptions about environmental equality; than SNP‑based estimates of additive, tagged variation. When these disagree, the discrepancy is not a nuisance to be waved away; it is a clue about mechanisms (rare and structural variation, indirect genetic effects, assortative mating, developmental and contextual modulation) that we should follow to build better models.
In short, the literature since 2017 has moved strongly in the direction of explanation, not dismissal. For some traits (especially height and BMI), WGS and LD/MAF‑aware modeling recover much of the gap; for others (notably psychiatric and many social phenotypes), large and biologically meaningful differences remain between pedigree and molecular estimates. Those differences have already catalyzed advances in measuring rare and structural variation, designing within‑family studies to isolate direct effects, and diversifying cohorts to improve portability. That is not what a “red herring” looks like, it is what a generative scientific puzzle looks like.
guys can we do a debate between hereditarians and environmentalists
sasha gusev and eric turkenheimer vs ISIR