

Dry and pedantic people are attracted to data analysis like anime attracts degenerates, though one should not confuse what a thing attracts and what it is.
To show how data analysis can be artful, allow me to present an example of artless data analysis, done by none other than myself 3 years ago. It was data analysis I conducted for somebody who was interested in the effect Jews have on GDP per capita in Europe. I should note that this is a bad thing to research in the first place. If I recall correctly, there already was superior research that shows that European subregions with larger Jewish populations grew to greater economic heights. And even if that analysis did not exist, the question is not valuable enough for my attention.
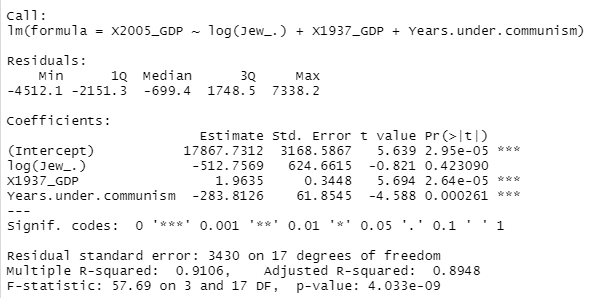
Onto the piece itself, I tested whether the Jewish population fractions in Europe were related to GDP per capita in 2005 when controlling for prior economic development in 1937 and years spent under communist regimes. Using regression models, I concluded that Jews and Europeans had roughly equal influences on the GDP per capita of European nations. I then argued that, given Jews are more intelligent than Europeans, that this suggests that Jews may negatively influence the economy by directing nations towards more socialistic regimes.
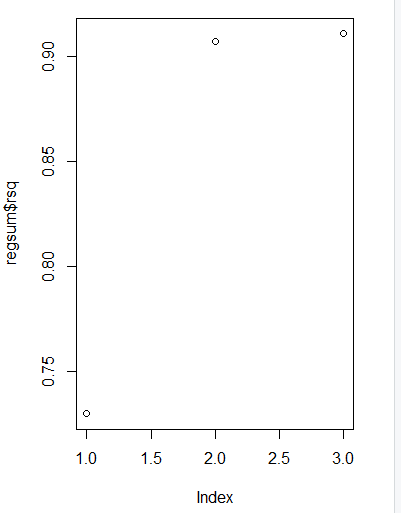
I did all of the “right” things: I checked the distributions of the variables and transformed them when necessary, concluded that p > .05 was probably a null, compared models using statistics like R^2 and BIC, selected good controls, noted that there were not many countries in the dataset (22), and made no unforced errors. I even provided my code and data. Ultimately I came to the incorrect conclusion.
What went wrong?
First of all, the idea that Jews were a driving factor behind certain European countries being more socialist than others is historically ignorant. The reason why the East was Communist was because the Soviet Union won the war and not because of political forces within individual Eastern bloc countries. On Russia itself, one blog went through the grunt work of tallying the Jewishness of the Russian Bolsheviks and they found that Jewish overrepresentation in the party itself was negligible. At the top of the Bolshevik party, roughly 20% of members were Jewish despite Russia being only 1.8% Jewish. Which is actually a pretty large level of overrepresentation, but it’s not inconsistent with their levels of political involvement across the spectrum and it’s substantially lower than 50%.
The post is also unaesthetic. It’s poorly written, the variables aren’t renamed, the heading structure is inconsistent, and the charts are gibberish.
Reviewer 21 would have accepted this data analysis if it were packaged with an introduction, proper grammar/spelling, and pretty charts. But it should have been rejected due to its artlessness, not its lack of structure or formality.
This is also why I am skeptical of attempts to fix academia2; good data analysis and thought cannot be taught using systems and rules, it is the process of skillfully applying said rules and systems for the purposes of achieving valued goals. The rationality of science is illusory: must we clarify that we do not know how well our senses map the phenomenal to the noumenal? Must we defend the idea causality exists and is not an artefact of our own minds? Often our arguments and reasoning relies on implicit assumptions and intuitive leaps that we do not bother writing.
An example of artful data analysis would be my chart of relatedness between family members in various traits3:
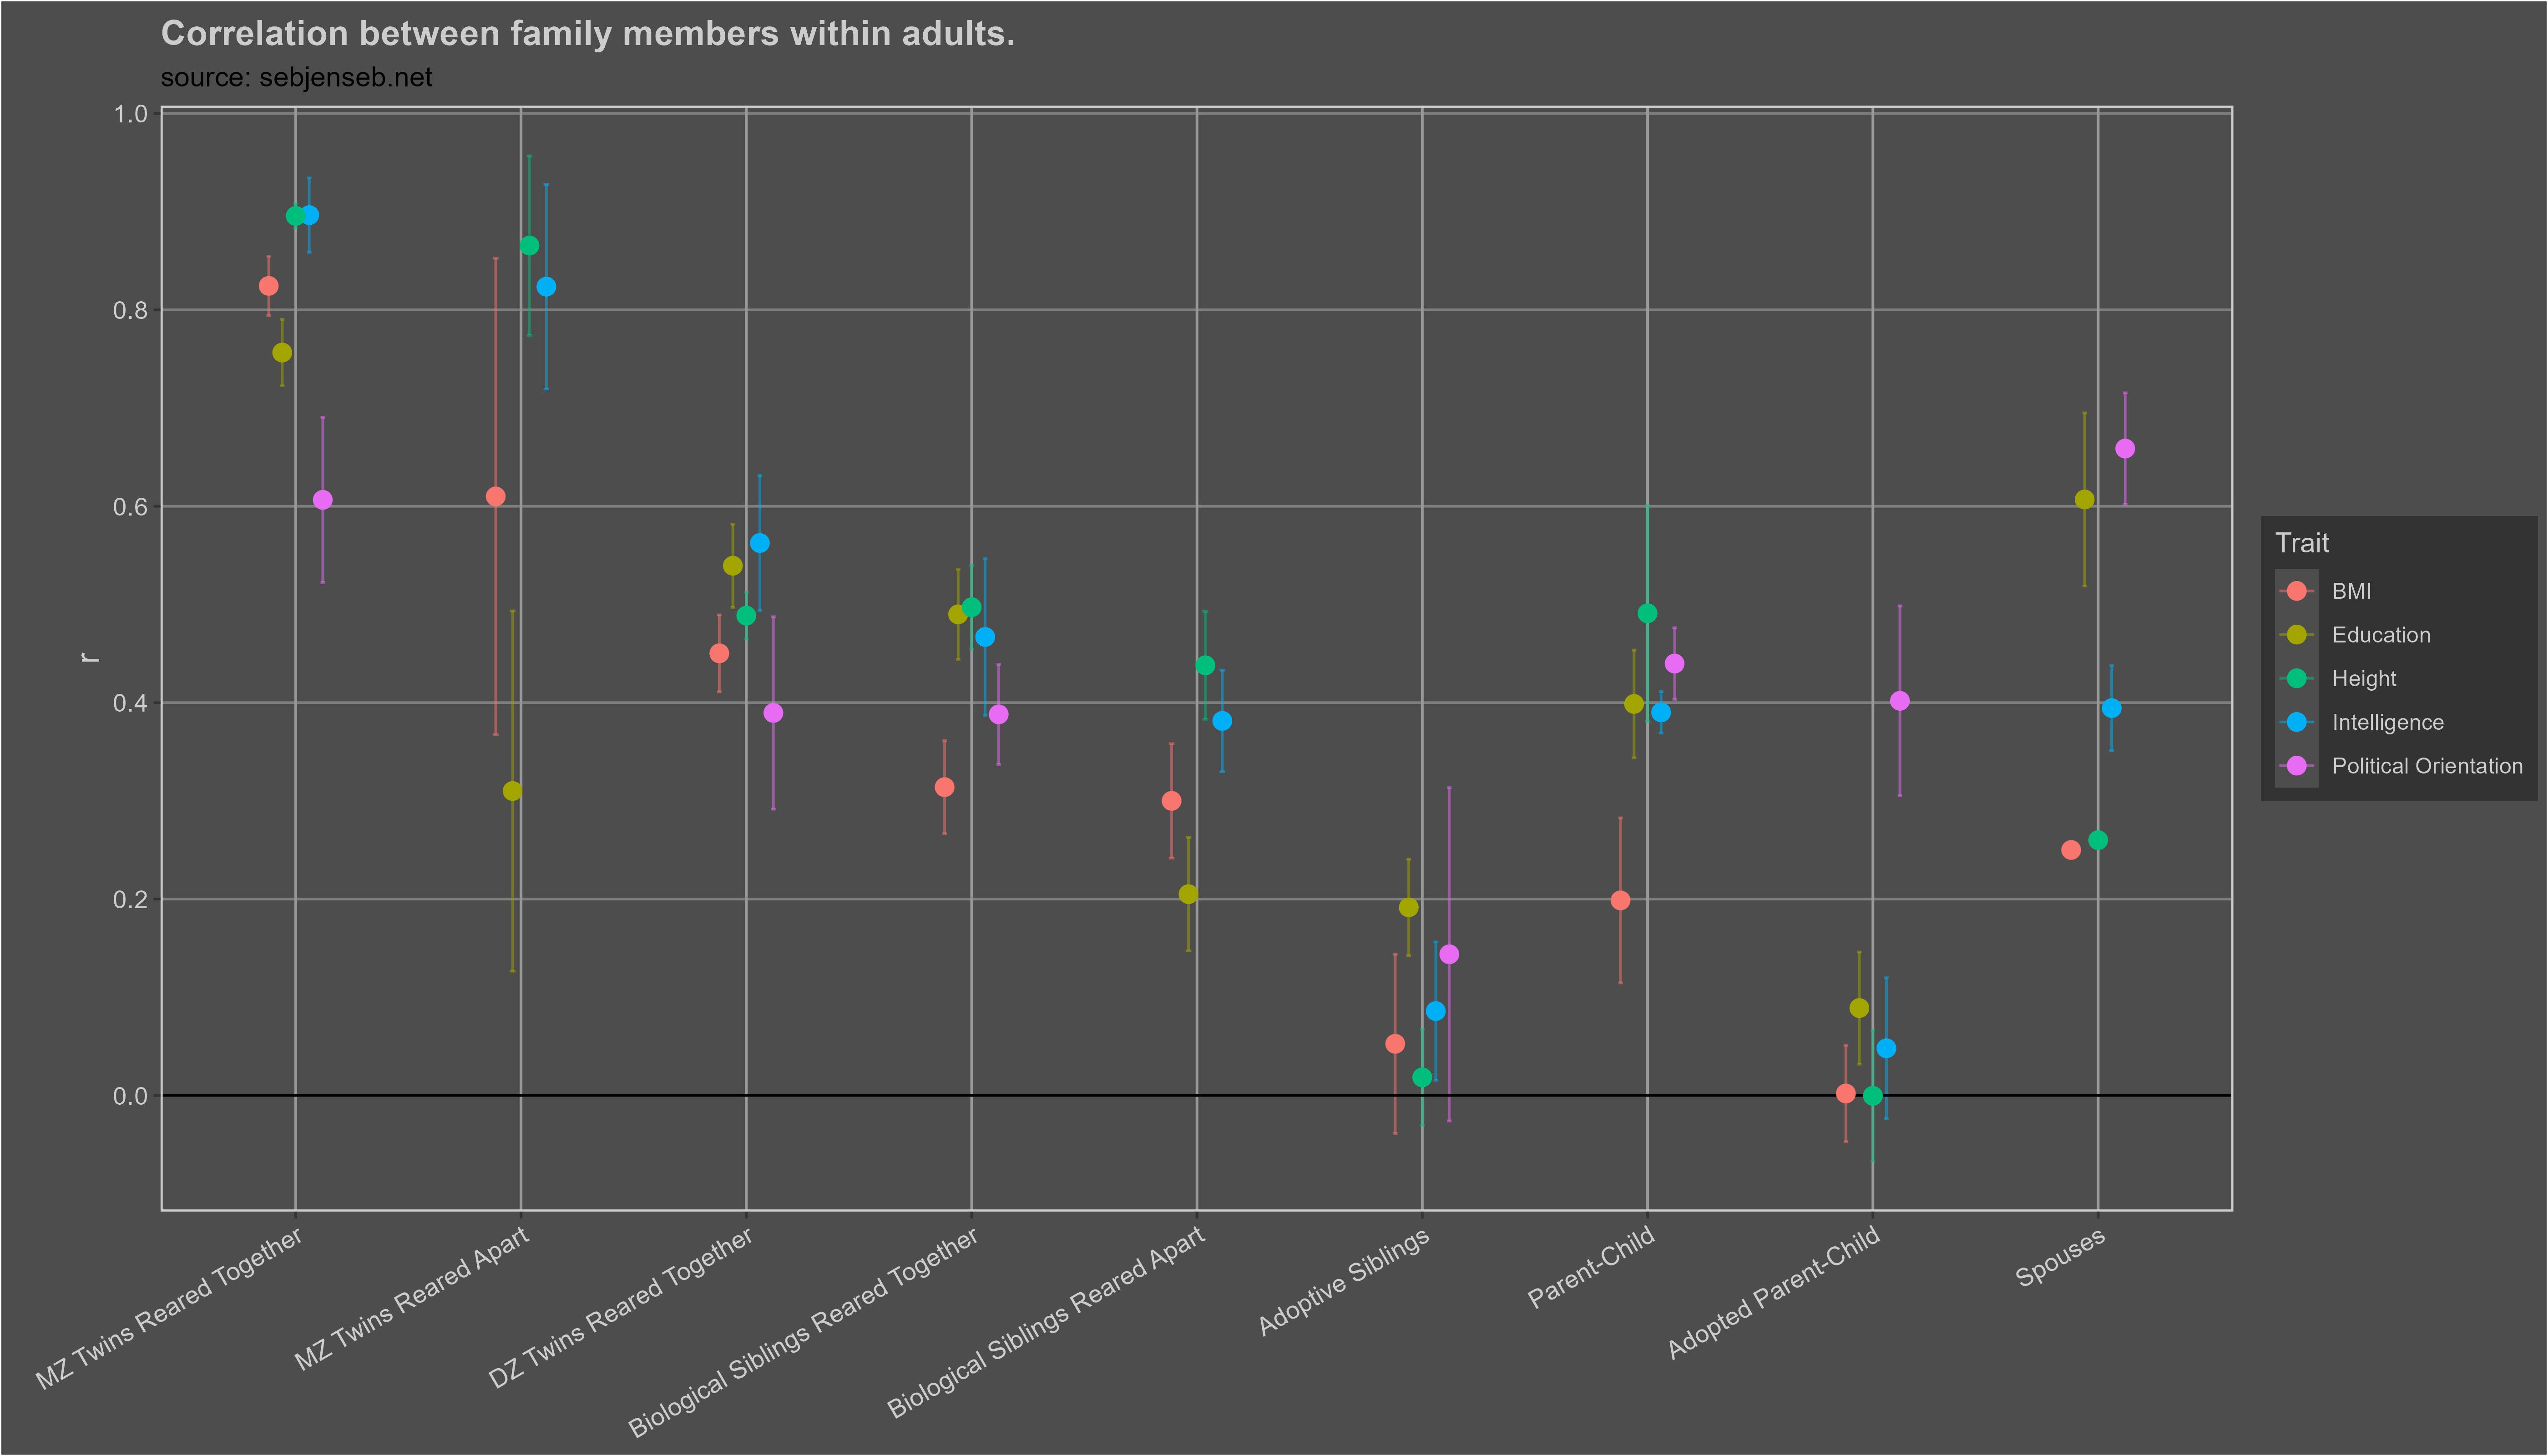
There are numerous technical problems with this chart: the original version had an incorrect value for the correlation between MZ twins in education, the confidence intervals were calculated using the simple formula of mean +- 1.96 x SE without regard to degrees of freedom, and I ran random effects meta-analyses within each kin/trait group knowing that the variance in effect sizes within all of the pairs could be used as a Bayesian prior for the variance within a specific kin/trait group4.
But I posted it anyway because it was good.
I particularly like the selection of traits I included into the analysis. If you were to see the same chart but for only height/intelligence/education, then some people would think that there is something wrong with the methodology: perhaps adopted parents can’t influence their children the way biological ones can or maybe the children were adopted too late. Adding political orientation to the chart settles both of these doubts and shows that the method can detect parental influence when it does really exist.
There’s chances the reader will not pick up on that or could even think that the large correlation observed between adopted parents/children is a function of heterogeneity in methodology between studies (for example, maybe the study of political beliefs in adopted parents/children has higher quality measures of political beliefs or less random adoption that results in the correlation being higher relative to other studies).
Fortunately, a similar dynamic exists in other portions of the chart: perhaps somebody doubts whether the association in intelligence between identical twins is due to genetics. If they think it’s due to upbringing, they can shift their eyes rightwards and realise that the correlation between identical twins reared apart is similar. If they doubt that, then they can observe that the same pattern holds for biological siblings or nominally unrelated individuals.
A side note
I’ve lost interest in human biodiversity. This happened for many reasons, though I’d say the biggest one was realising that there is not a lot of room for new and good ideas to shine.
To date I’ve only been able to come up with two ideas that satisfy both of those criteria: one is my theory of interracial selection5, which is that neurodivergent people tend to interracially date and as a result of genetic transmission mixed-race individuals are more neurodivergent relative to monoracial ones, even if one accounts for ancestry, discrimination, or the effects of genetic mixing itself; the other is that there is assortative mating between races beyond characteristics that differentiate interracial daters themselves.
I still have a few things to do on the internet — the biggest one is a 2+ hour long video on the likelihood of collapse in this century, covering global warming, mutational load, differential6 fertility, genomic collapse due to outbreeding, cultural drift/birth rates, immigration, AI risk, resource depletion, nuclear war, pandemics, and so on7. Essentially a video version and update of this post.
My intuition is that collapse is unlikely (5-10% chance).
Civilization is much more robust than believed: people rebuilt after World War II, nuclear explosions, and natural disasters, and COVID. Surely there’s some threshold at which civilization cannot be rebuilt after a certain number of deaths happen, which I should at least attempt to estimate.
With regard to other collapse theories: mutational load theory is noise, climate threat is exaggerated, the earth will not run out of resources in the forseeable future, and AI risk is rationalist neuroticism. The birth rates are problematic for the economy, but a declining economy and a collapsing one are not the same. I also think it’s extremely unlikely that humans celibate themselves to death.
More interesting is whether human life worsens in quality over the next century. My intuition is that it probably will, especially if the birth rate issue continues. I’ve already developed an economic model that predicts future GDP based on population projections, changes in national IQ, and previous patterns in growth.

I think art and culture could potentially improve due to AI tools and generational change (millennials have been particularly awful artists). The medium-term future (50-200 years in the future) looks culturally bleak to me: intelligence and population size decline should start showing at that point.
I also have a stake in the question I’m researching; it is likely that I live to see this century in its entirety given progress in life expectancy and my lifestyle/location. The same is not true for most of the people who have similar or greater mastery of genetics, climate, AI, and birth rates; assuming they exist in the first place.
It is a high hanging fruit but it sure as hell is a fat one.
He exists. In my “world of ideas”.
Goodhart’s law, where making a measure a target makes the measure devoid of value, also applies to academia. If you force people to make their data public, they will mail in the process or fabricate it. More stringent p-value cutoffs would lead to the cutoffs being at different places and pedants rejecting p = .011 because of muh cutoff. Public peer review would just be a glorified supplementary text. The limiting factor in the quality of academic work in the current year is attention and will, not intelligence or systems. The idea that academia and academics can somehow be salvaged is lowkey blank slatist; good data analysis is not genetic in the strict sense but a monkey cannot be taught how to fly.
Which I skillfully plagiarised from David Cesarini. Nice plot format bro, but it’s mine now.
For example, if there are two correlations in income in MZ twins reared apart and they are .3 and .8, you could think you have no idea what the correlation actually is, but if the variance in other correlation groups is relatively small, then your priors should be that they are just a fluke.
We sure love our euphemisms, don’t we folks?
I think these could be neatly categorised into genetic decline, death, demographic shifts, and ecological collapse, though I think that grouping results in missing on a lot of important detail; the reasons why mutational load theory is wrong and why differential fertility will not destroy civilization are not the same.
Showing that IQ is left-tailed when giftedness quacks have been claiming it's right-tailed is a third thing; looking forward to the likelihood of a collapse video.
The funny thing about HBD is that after you spend a few years deeply involved in it you more or less just come around to what most people think intuitively based on stereotypes. You didn't need to read all those charts to realize Asians are good at math, etc.